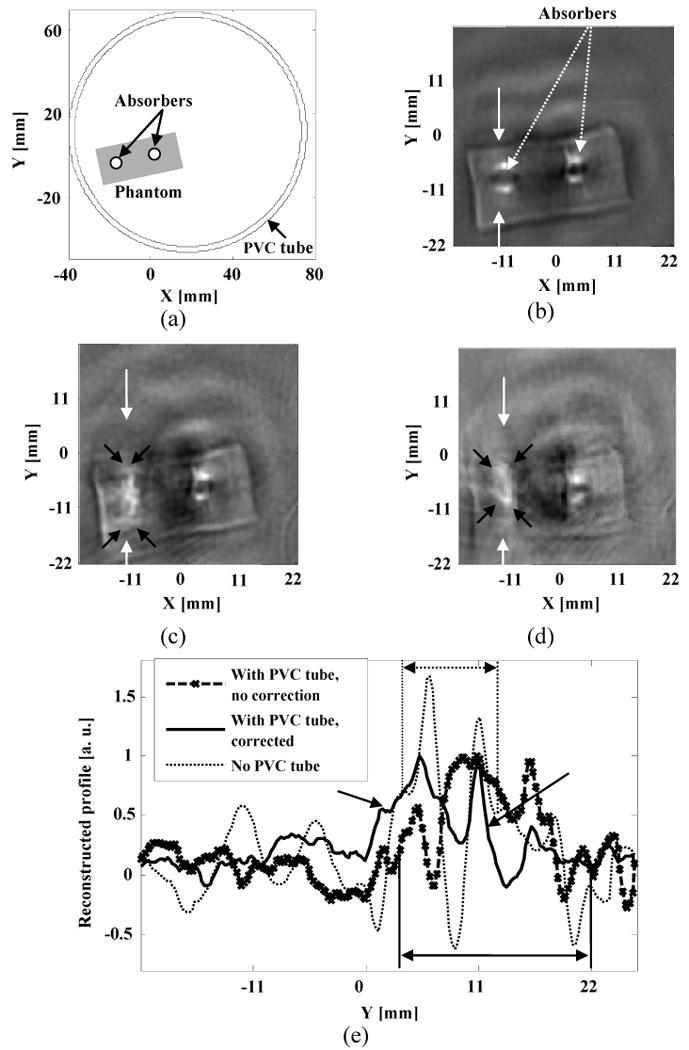
Figure 7.

Experimental results with two strong absorbers: (a) Schematic of the phantom sample used in experiments; (b) Reconstructed image with no PVC tube present. The boundaries of the two absorbers are shown clearly in the reconstructed TAT image; (c) Reconstructed TAT image using the filtered back-projection method. PVC tube was used to simulate the skull effects; (d) Reconstructed TAT image using the proposed numerical method. The raw data was the same as the one used for (c); (e) Comparison of the reconstructed signals at the depth as marked on (b), (c) and (d).
