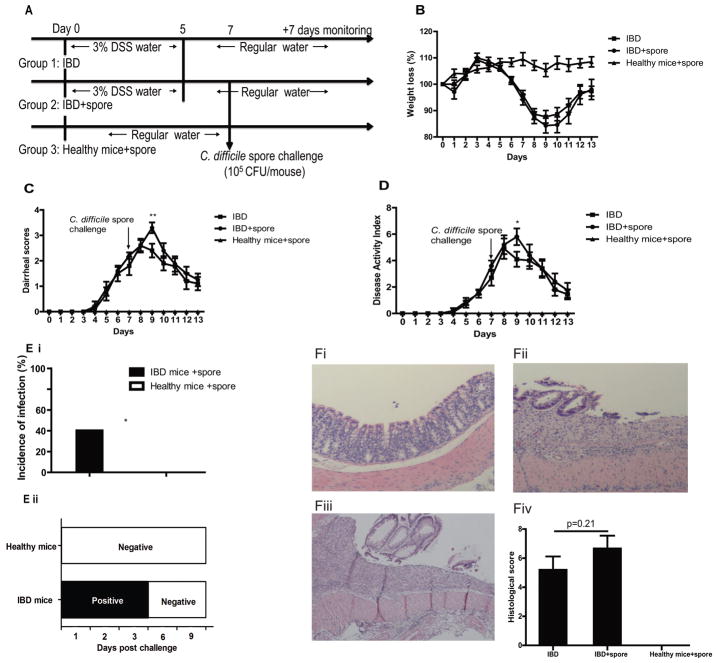
FIGURE 1.
DSS-induced IBD mice are more susceptible to CDI. A, Experimental design schematics: IBD model and IBD with spore challenge. Group 1, IBD alone mice; group 2, IBD mice infected with C. difficile spores; group 3, healthy mice infected with C. difficile spore; n = 10 mice per group. B, Weight loss, (C) diarrhea scores, and (D) DAI of each group are shown. The data shown are mean ± SEM, and asterisks show significant differences between group 1 and group 2. *P < 0.05; **P < 0.01. E, After spore challenge, C. difficile toxins and spores in fecal samples are indicators of infection. CDI rate of IBD mice and healthy mice (Ei) according to the results of toxin-mediated cytotoxicity from feces sample extracts. Spore shedding in feces on day 1 (D1), D2, D3, D6, and D9 after spore challenge (Eii). *P < 0.05. F, The histopathologic changes in colon tissues of healthy mice challenged with C. difficile spore (Fi), IBD alone mice (Fii), IBD mice challenged with C. difficile spore (Fiii), and the histological scores of the 3 groups (Fiv). (H&E staining, X100).

