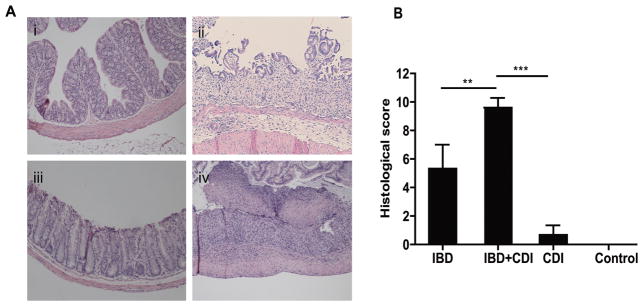
FIGURE 4.
The histopathologic changes in colon tissues of IBD, CDI, and IBD+CDI mice. (H&E staining X100). Colon tissue of control group (Ai), the IBD group (Aii), the CDI group (Aiii), the IBD+CDI group with pseudomembrane (arrow) (Aiv), and the histological scores of the 4 groups (B). *P < 0.05; **P < 0.01; ***P < 0.001.

