Abstract
The fundamental of neuroscience is to connect the firing of neurons to physiological and behavioral outcomes. Chemogenetics enables researchers to control the activity of a genetically defined population of neurons in vivo through the expression of designer receptor exclusively activated by designer drug (DREADD) in specific neurons and the administration of its synthetic ligand clozapine N-oxide (CNO) (Sternson and Roth, 2014). Using stimulatory Gq-coupled DREADD (hM3Dq) in mice, we showed that leptin receptor (LepRb)-expressing neurons in the preoptic area (POA) of the hypothalamus are warm-sensitive neurons that mediate warm-responsive metabolic and behavioral adaptations by reducing energy expenditure and food intake (Yu et al., 2016). We also used DREADD technology to test effects of chronic stimulation of POA LepRb neurons on energy expenditure, food intake, and body weight with the TSE indirect calorimetry system. Here we describe the detailed protocol of how we used indirect calorimetry to study the outcome of chronic stimulation of POA LepRb neurons. This protocol can be adapted to study long-term metabolic and behavioral consequences of other neuronal modulations, with possible modifications to the type of DREADD, duration of CNO treatment, or method of CNO delivery.
Keywords: Chemogenetics, DREADD, Energy expenditure, Food intake, Indirect calorimetry, TSE
Background
The POA is a central hub for body temperature homeostasis, which receives thermosensory information from the periphery and tunes the degree of sympathetic output to brown adipose tissue (BAT), cutaneous blood vessels, and heart to control the amount of heat generation and dissipation (Nakamura, 2011). We discovered that LepRb neurons in the POA are stimulated by warm ambient temperature and mediate warm-adaptive responses that include suppression of BAT thermogenesis and food intake (Yu et al., 2016). This discovery was made mainly through chemogenetic stimulation of POA LepRb neurons by virally expressing Gq-coupled DREADD, hM3Dq, in POA LepRb neurons and injecting CNO in mice. A single IP injection of CNO can stimulate target neurons up to 10 h (Krashes et al., 2011; Rezai-Zadeh et al., 2014). This long-lasting CNO effect allows researchers to modulate target neuron activity chronically with two IP injections of CNO per day.
Optogenetics and chemogenetics have revolutionized the field of neuroscience by providing tools to selectively manipulate target neuron activity with its own unique advantages and disadvantages. For studying neurons that modulate energy balance, researchers often use an indirect calorimetry system to simultaneously measure energy expenditure and food intake for an extended period of time (Rezai-Zadeh et al., 2014; Correa et al., 2015; Qualls-Creekmore et al., 2017). Chemogenetics is best suited for this type of study thanks to slow clearance of CNO from the body and no requirement of optical devices as in optogenetics. In our study, we investigated consequences of chronic stimulation of POA LepRb neurons by DREADD with the PhenoMaster indirect calorimetry system. CNO was injected at 0.3 mg/kg twice per day for six days, and energy expenditure and food intake were continuously measured every 25 min. Body weight was measured once every morning to monitor how changed energy expenditure and food intake affected body weight. In this protocol, we describe a step-by-step procedure of using the TSE PhenoMaster indirect calorimetry system to measure energy expenditure and food intake during chronic stimulation of POA LepRb neurons by DREADD in mice.
Materials and Reagents
½ CC Lo-dose U-100 insulin syringe 28 G ½ (BD, catalog number: 329461)
1.5 ml microcentrifuge tube (SARSTEDT, catalog number: 72.690.301)
-
LepRb-Cre mice
Notes:
In-house bred and derived from original breeders kindly provided by Dr. Martin Myers, Jr., University of Michigan (Leshan et al., 2006); that were injected with AAV5-hSyn-DIO-mCherry (Vector Core, University of North Carolina at Chapel Hill) in the POA (control group, 3 month old, 3 males and 2 females, n = 5).
LepRb-Cre mice that were injected with AAV5-hSyn-DIO-hM3Dq-mCherry (Vector Core, University of North Carolina at Chapel Hill, kindly made available by Dr. Bryan Roth) in the POA (experimental group, 3 month old, 3 males and 2 females, n = 5).
All experiments were approved by the Institutional Animal Care and Use Committee at Pennington Biomedical Research Center.
CNO (Sigma-Aldrich, catalog number: C0832)
Saline/0.9% NaCl (B. Braun Medical, catalog number: L8001)
CNO stock (see Recipes)
CNO working solution (see Recipes)
Equipment
PhenoMaster (TSE systems)
Scale (Ohaus, Scout-Pro, model: SPE601)
Vortex Mixer (American Scientific Products, catalog number: S8223-1)
Software
LabMaster V5.0.8 (TSE systems)
Excel 2010 (Microsoft)
SPSS 22 (IBM)
Procedure
A. Setting up the PhenoMaster TSE system
-
Measure body weight of each mouse that will be used for the experiment.
Note: Age of mice was matched to eliminate the confounding effect of age on energy expenditure and food intake and to minimize the body weight difference between mice. At the beginning of the experiment, mouse body weight ranged between 20 g and 30 g. It is important to use mice with similar body composition to minimize errors during data analysis when body weight is used to normalize energy expenditure and food intake.
Open LabMaster and calibrate gas sensors for O2 and CO2, and weight scales for food and water according to manufacturer’s manual. It is not necessary to turn on the system before calibration.
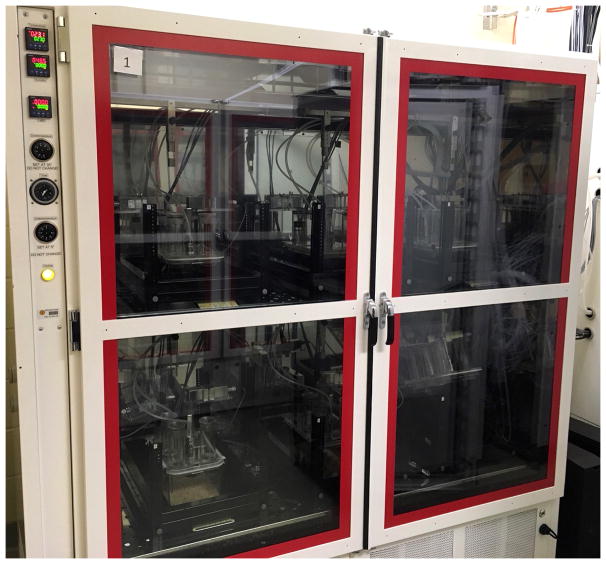
Turn on climate chambers and set the temperature at 23 °C (Figure 1).
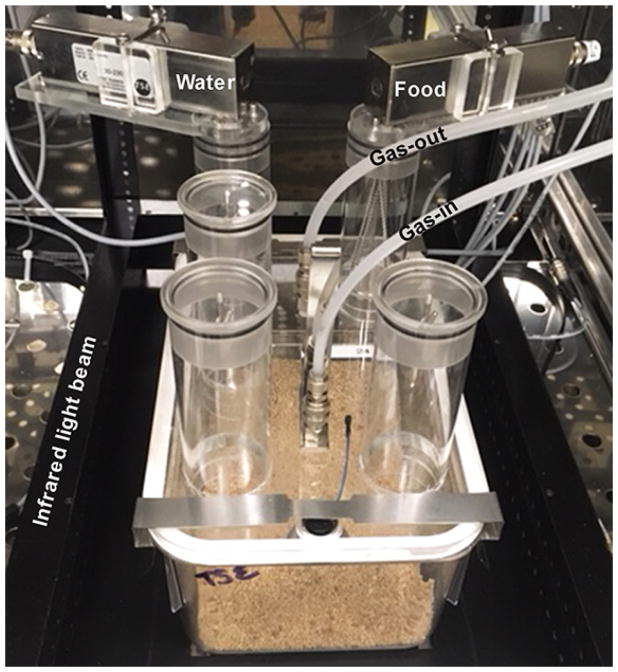
Transfer mice to housing boxes (1 mouse/box; Figure 2) and securely seal lids using 2 latches per cage (one front and one back; Figure 2).
Fill water bottles with tap water and food hoppers with regular chow, and hang them at corresponding weight sensors. It is important to check each water bottle and food hopper for good water flow and accessibility of food pellets, respectively.
Under the ‘Setup’ tab in LabMaster, input animal IDs, body weight, and set up other parameters such as a measurement interval. In our experiment, the measurement interval was 25 min.
Under the ‘Measurement’ tab, select ‘Start’ to begin measurements.
Figure 1. The PhenoMaster TSE system.
One climate chamber can harbor 6 boxes that can measure O2, CO2, food intake, water consumption.
Figure 2. A mouse housing box for the PhenoMaster TSE system.
Each box is equipped with tubing for gas in and out, weight sensors for water and food, and an infrared light beam frame for locomotor activity.
B. Daily injections and body weight measurement
Notes:
The room had a 12:12 light:dark cycle with the light on at 7 AM and off at 7 PM.
Whenever opening a box to measure body weight, refill water or food, or perform injections, it is important not to open the lid while the system is measuring that specific box to prevent outside air from coming into the box. It is safest to open the lid of a box right after the system has just finished measuring that box. Select ‘Status > Calo’ in LabMaster to identify the box the system is actively measuring.
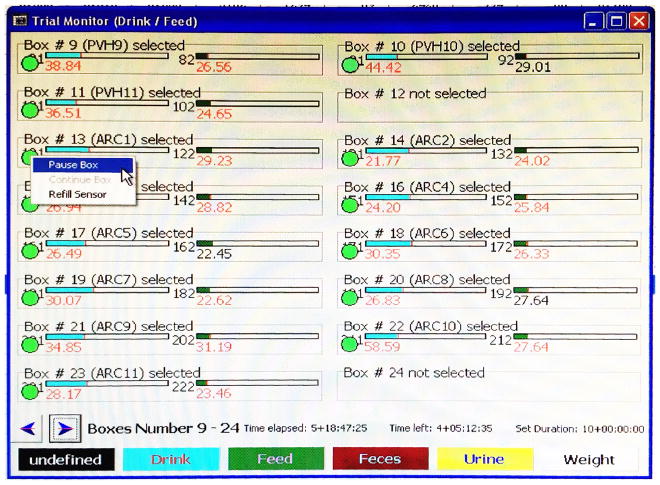
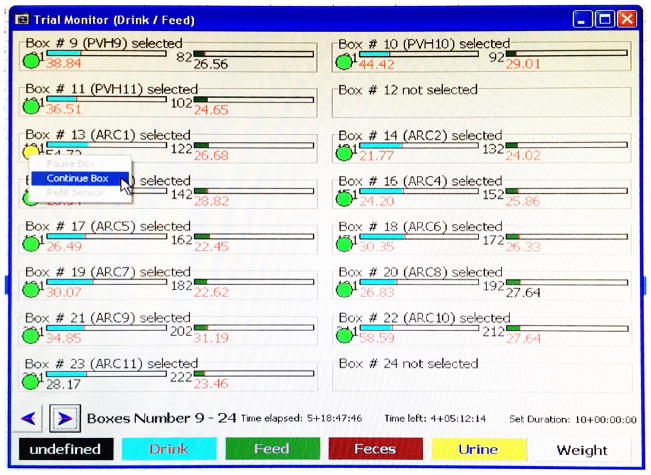
Before opening the box, select ‘Status > Trial Monitor Drink/Feed’ in LabMaster to open the box monitoring screen (Figure 3). Right click on the green circle underneath a box number, and then select ‘Pause Box’ to temporarily pause measurements of that box (Figure 3). The circle turns yellow. Once the box lid is back on and sealed, right click the same circle and select ‘Continue Box’ to resume measurements (Figure 4).
Once a week during the experiment, replace dirty mouse box bottoms with clean ones and refill water bottles with fresh water.
When an accident happens, such as opening of a box while the system is reading the same box, data from that time point for that box should not be used for later analysis.
Figure 3. Example image of Trial Monitor Drink/Feed screen.
The green circles under box numbers indicate boxes included for measurements. In this example, boxes #12 and #24 are not included in the experiment.
Figure 4.
Example image showing how to continue measurements of a temporarily paused box
For overall experimental scheme, see Figure 5.
Day 1–3: Let mice acclimate to a new environment without any disturbance other than refilling water or food. During this period, if water leaks and floods the bedding, replace the faulty parts (e.g., sipper or entire bottle) and the box bottom.
Day 4–15: body weight measured daily at 9 AM for each mouse.
Day 4–6: saline IP injection twice daily at 9:30 AM and 6 PM for each mouse. Detemin the amount of saline injection by the body weight of the day, such that it matches the amount of CNO working solution (0.06 mg/ml) that would have been needed for that body weight to achieve the dose of 0.3 mg/kg. For example, 20 g mouse receives 100 μl of saline.
Day 7–12: CNO IP injection (0.3 mg/kg) twice daily at 9:30 AM and 6 PM for each mouse. The amount of CNO injection is determined by the body weight of the day as described above.
Day 13–15: mice recover from daily injections (no injection).
Figure 5. Overall experimental scheme.
Mice were first acclimated to a new environment and then injected with 3 days of saline followed by 6 days of CNO. Body weight was measured every morning.
C. Finishing the experiment and retrieving data
On day 14 after morning body weight measurement, stop measurements by selecting ‘Measurement > Stop’ in LabMaster.
Take out mice and put them in regular housing cages with water and food.
To export data, first go to ‘View’ to select parameters and box numbers to export data.
Select ‘Export > Table’, then designate file name and location.
Data analysis
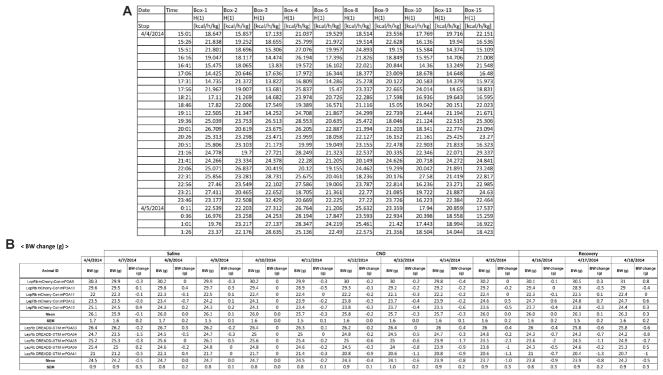
Open the exported file in Microsoft Excel (Figure 6A).
Copy energy expenditure (H(1) in kcal/h/kg) and food intake (Feed in g) data to a new tab or file.
Make a table in Excel for daily body weight (Figure 6B).
Divide data based on the group and calculate means and standard errors for all time points in each group.
For body weight analysis, calculate body weight change for each day in reference to the body weight on the first CNO injection day.
For energy expenditure and food intake analysis, calculate daily means (kcal/g/day) separately for saline injection (3 days), CNO injection (6 days), and recovery (2 days) (Figure 7).
Perform statistical analysis by repeated measures ANOVA (analysis of variance) in SPSS. Multiple pairwise comparisons were corrected by the Bonferroni method.
Figure 6. Example tables for data analysis.
A. A part of the energy expenditure data table that was exported by LabMaster. B. The body weight table that shows daily body weight of all mice, group means, and standard errors of the means during the experiment.
Figure 7. The table for daily food intake analysis.
Daily food intake was averaged for each treatment condition, and group means were compared.
Notes
Homozygous LepRb-Cre mice were used to maximize Cre expression for more efficient viral gene expression.
Recipes
-
CNO stock (5 mg/ml)
Add 1 ml saline to 5 mg of CNO powder
Vortex until the powder is fully dissolved
-
Transfer to a 1.5 ml microcentrifuge tube and keep the stock at 4 °C
Note: Stock CNO is stable at 4 °C for 6 months at least. However, CNO may precipitate over time. Adding a small amount of DMSO (3–10%) may help dissolving CNO and preventing precipitation.
-
CNO working solution (0.06 mg/ml)
Take out and equilibrate the CNO stock solution to room temperature
Vortex to mix and dissolve any possible CNO pellets
Dilute the CNO stock 83.3-fold with saline to achieve a final concentration of 0.06 mg/ml. For example, to make 1 ml working solution, add 83 μl CNO stock to 917 μl saline
Make it fresh on the day of injection and use it as room temperature solution without warming it up to body temperature
Acknowledgments
This work was supported by AHA053298N, P/F DK020572-30, R01DK092587 (HM), P20GM103528 (HM and SY), and 2P30-DK072476 (HM and SY). Partial support was provided through the Animal Phenotyping Core funded by NIDDK NORC Center Grant P30 DK072476. The authors declare no competing financial interests. This protocol is adapted from procedures published in Yu et al. (2016).
References
- 1.Correa SM, Newstrom DW, Warne JP, Flandin P, Cheung CC, Lin-Moore AT, Pierce AA, Xu AW, Rubenstein JL, Ingraham HA. An estrogen-responsive module in the ventromedial hypothalamus selectively drives sex-specific activity in females. Cell Rep. 2015;10:62–74. doi: 10.1016/j.celrep.2014.12.011. [DOI] [PMC free article] [PubMed] [Google Scholar]
- 2.Krashes MJ, Koda S, Ye C, Rogan SC, Adams AC, Cusher DS, Maratos-Flier E, Roth BL, Lowell BB. Rapid, reversible activation of AgRP neurons drives feeding behavior in mice. J Clin Invest. 2011;121(4):1424–1428. doi: 10.1172/JCI46229. [DOI] [PMC free article] [PubMed] [Google Scholar]
- 3.Leshan RL, Bjornholm M, Munzberg H, Myers MG., Jr Leptin receptor signaling and action in the central nervous system. Obesity (Silver Spring) 2006;14(Suppl 5):208S–212S. doi: 10.1038/oby.2006.310. [DOI] [PubMed] [Google Scholar]
- 4.Nakamura K. Central circuitries for body temperature regulation and fever. Am J Physiol Regul Integr Comp Physiol. 2011;301(5):R1207–1228. doi: 10.1152/ajpregu.00109.2011. [DOI] [PubMed] [Google Scholar]
- 5.Qualls-Creekmore E, Yu S, Francois M, Hoang J, Huesing C, Bruce-Keller A, Burk D, Berthoud HR, Morrison CD, Munzberg H. Galanin-expressing GABA neurons in the lateral hypothalamus modulate food reward and noncompulsive locomotion. J Neurosci. 2017;37:6053–6065. doi: 10.1523/JNEUROSCI.0155-17.2017. [DOI] [PMC free article] [PubMed] [Google Scholar]
- 6.Rezai-Zadeh K, Yu S, Jiang Y, Laque A, Schwartzenburg C, Morrison CD, Derbenev AV, Zsombok A, Munzberg H. Leptin receptor neurons in the dorsomedial hypothalamus are key regulators of energy expenditure and body weight, but not food intake. Mol Metab. 2014;3(7):681–693. doi: 10.1016/j.molmet.2014.07.008. [DOI] [PMC free article] [PubMed] [Google Scholar]
- 7.Sternson SM, Roth BL. Chemogenetic tools to interrogate brain functions. Annu Rev Neurosci. 2014;37:387–407. doi: 10.1146/annurev-neuro-071013-014048. [DOI] [PubMed] [Google Scholar]
- 8.Yu S, Qualls-Creekmore E, Rezai-Zadeh K, Jiang Y, Berthoud HR, Morrison CD, Derbenev AV, Zsombok A, Munzberg H. Glutamatergic preoptic area neurons that express leptin receptors drive temperature-dependent body weight homeostasis. J Neurosci. 2016;36(18):5034–5046. doi: 10.1523/JNEUROSCI.0213-16.2016. [DOI] [PMC free article] [PubMed] [Google Scholar]


