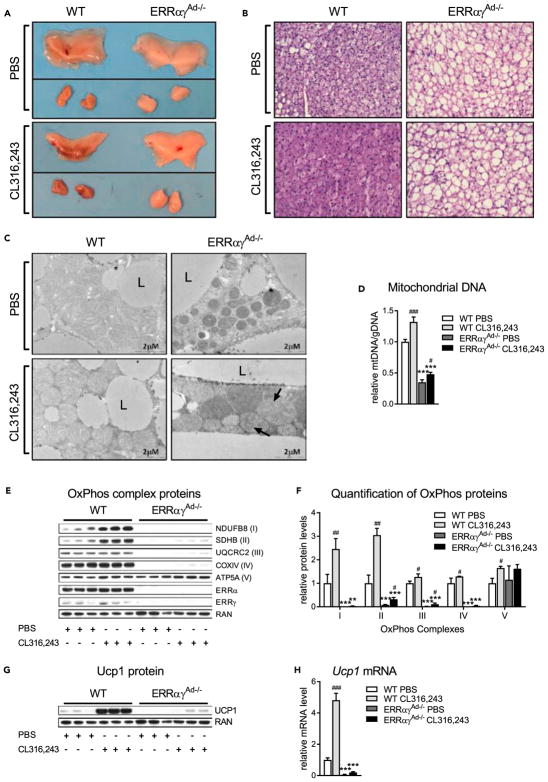
Figure 3. Effect of 10 Days’ Treatment with CL316,243 on BAT of WT and ERRαγAd−/− Mice.
(A) Gross morphology of interscapular BAT from WT and ERRαγAd−/− mice. Upper panel: PBS (before and after dissection from surrounding WAT). Lower panel: CL316,243 (before and after dissection from surrounding WAT).
(B) H&E staining of BAT at 400× magnification.
(C) Electron microscopy of mitochondria and surrounding lipid droplets in BAT. L, lipid droplet; arrows point to abnormal cristae formations.
(D) Relative mtDNA copy number, normalized to gDNA (n = 9–19).
(E) Representative western blot of OxPhos complexes I–V, ERRα, ERRγ, and RAN (loading control).
(F) Quantification of OxPhos western blots, normalized to RAN protein levels (n = 6–9).
(G) Representative western blot of Ucp1 protein and RAN (loading control).
(H) Ucp1 mRNA, normalized to Ppia mRNA (n = 6–7).
Male mice were born and raised at thermoneutrality (30°C), treated with PBS or CL316,243 for 10 days, and euthanized at 12 weeks of age. Data are mean ± SEM **p < 0.01, ***p < 0.001 vs. WT in the same treatment; #p < 0.05, ##p < 0.01, ###p < 0.001 vs. PBS in the same genotype. The same loading control (RAN) is presented in panels E and G. See also Figure S3 and Table S3.

