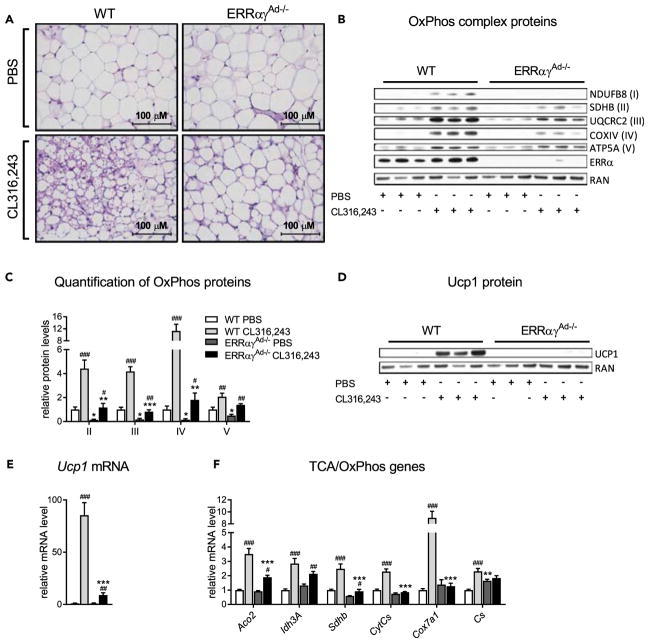
Figure 5. Effect of 10 Days’ Treatment with CL316,243 on ingWAT of WT and ERRαγAd−/− Mice.
(A) H&E staining of inguinal white adipose tissue (ingWAT) at 400× magnification.
(B) Representative western blot of OxPhos complexes I–V, ERRα, and RAN (loading control).
(C) Quantification of OxPhos complex levels, normalized to RAN protein levels.
(D) Western blot of Ucp1 protein and RAN (loading control).
(E and F) mRNA levels of Ucp1 and TCA/OxPhos genes, normalized to Ppia and expressed relative to levels in WT mice treated with PBS (n = 8–14).
Mice are from the same experiment as in Figure 3. Data are mean ± SEM *p < 0.05, **p < 0.01, ***p < 0.001 vs. WT in the same treatment; #p < 0.05, ##p < 0.01, ###p < 0.001 vs. PBS in the same genotype. The same loading control (RAN) is presented in panels B and D. See also Figure S5 and Table S3.

