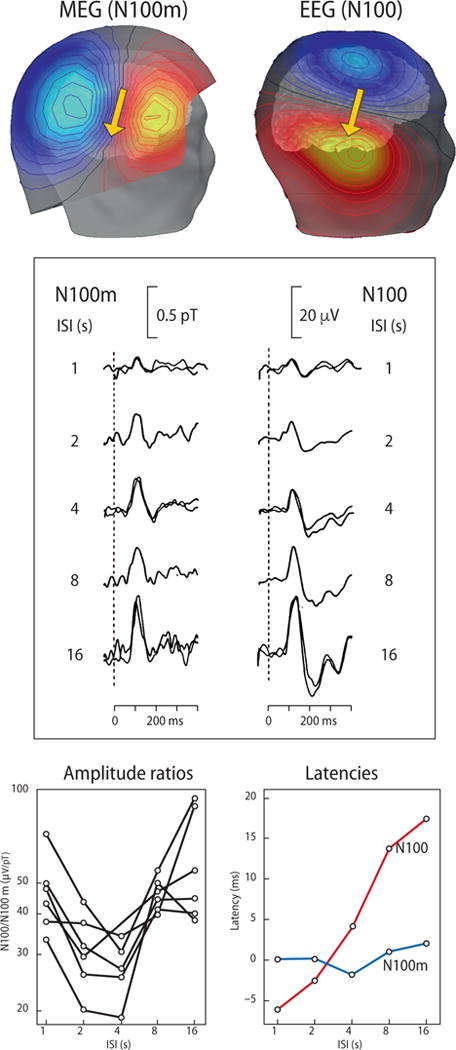
Fig. 5.

Auditory 100-ms evoked fields and potentials. Top panel: Field patterns for MEG (left, N100m) and EEG (right, N100) responses. These data were simulated for a current-dipole source (arrow) in the auditory cortex. Note that the MEG pattern is displayed about 3 cm above the scalp over the temporal lobe. In future MEG devices where the sensors can be placed very close to the scalp, the MEG field lines will be about 1/3 closer together. The red isocontour lines display magnetic field exiting the head and positive potentials. The blue isocontours depict magnetic fields entering the head and negative potentials. Middle panel: ISI dependence of N100m (recorded with an axial gradiometer from the right posterior maximum of the field pattern) and of N100 (recorded between vertex and right mastoid). Modified from Hari et al. (1982). Bottom left: Ratio of N100m/N100 as a function of ISI. Because this relationship is not flat, the electric and magnetic 100-ms responses cannot have identical sources. Bottom right: N100m and N100 latencies as a function of ISI. Latencies also behave differently as a function of the ISI. Modified from Tuomisto et al. (1983).
