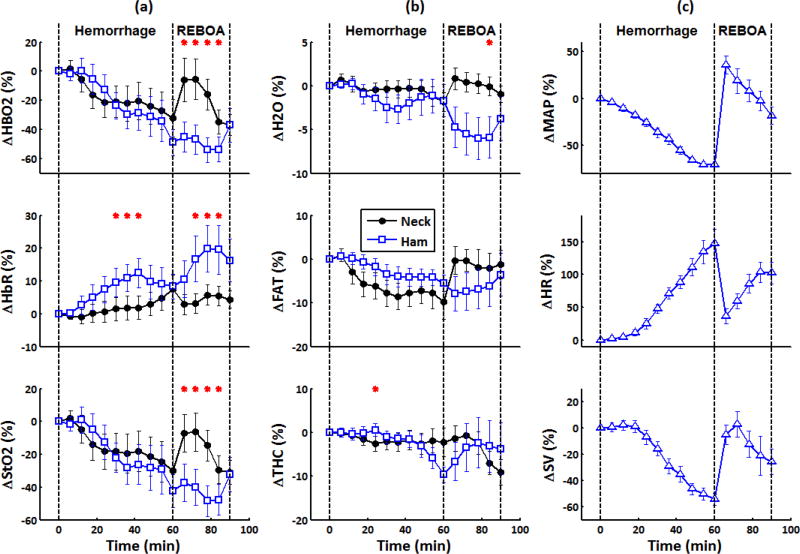
Figure 2.
Diffuse optical spectroscopy (DOS) and cardiac parameters from a generalized estimating equations model over time. Hemorrhage occurred from 0–60 minutes followed by REBOA at 60–90 mins. For all animals, channel 1 measured upstream from the aortic occlusion site (neck), while channel 2 measured downstream (ham). Each time point is an average of 6 minutes of data and is presented as the percent change from its baseline value. Significant difference between channels is denoted by a red asterisk (*). (a) Hemodynamic trends HbO2, HbR, and StO2 from the dual-channel DOS device (b) H2O, FAT and THC tissue parameters from the dual-channel DOS device (c) MAP, HR, and SV systemic parameters from various clinical instruments.(Note: HbO2 = Oxyhemoglobin; HbR = Deoxyhemoglobin; StO2 = Hemoglobin oxygenation saturation; THC = Total hemoglobin; H2O = Water; FAT = Lipid; MAP = Mean arterial pressure; HR = Heart rate; SV = Stroke volume)

