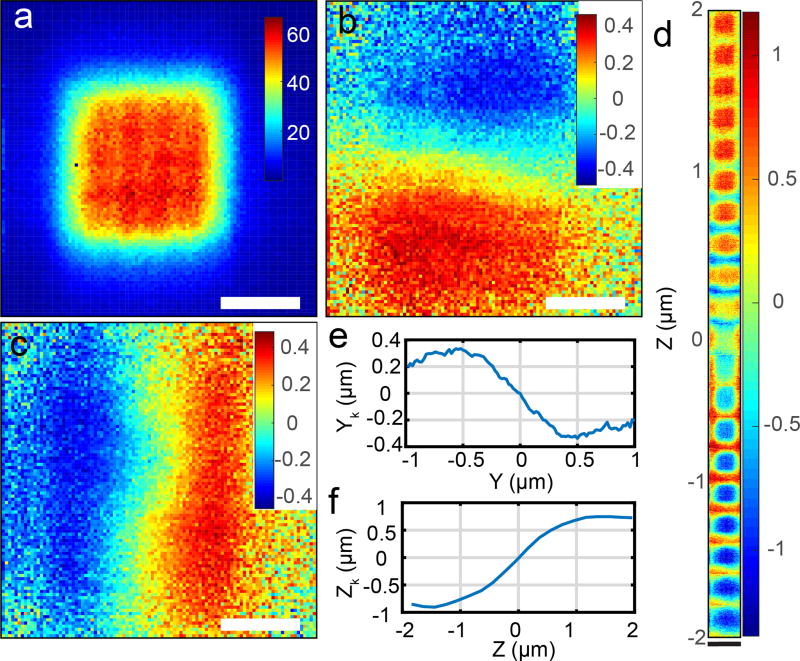
Figure 4. Particle scanning and position estimation.
(a) Scanning image of 190 nm fluorescent beads with 2D-EOD driving the laser in a 1 × 1 µm square knight’s tour pattern. Fluorescence intensity is denoted by color. Unit: kHz. (b) Estimation of xk, the particle’s position relative to the center of the 2D-EOD scan in micrometers. The color in b, c, and d denotes the estimated position. Unit: µm. (c) Estimation of yk in micrometers. (d) Estimation of zk, the particle’s position relative to the axial center of the TAG lens scan in micrometers. (e) Estimated particle position yk as a function of the stage position averaged over the entire grid from (c). Note that the estimated particle position acquired from the position estimation algorithm (yk) agrees with the real position. (f) Estimated particle position zk as a function of the stage position averaged over the entire grid from (d). The estimated position shows a linear relationship with particle’s real position over 1 × 1 × 2 µm range in X, Y, and Z direction. Note that the estimated particle position acquired from the position estimation algorithm (zk) agrees with the real position. The estimated position shows a linear relationship with particle’s real position over a 1 × 1 × 2 µm range in X, Y, and Z direction. The white scale bars in (a–c) represent 500 nm and the black scale bar in (d) represents 2 µm.

