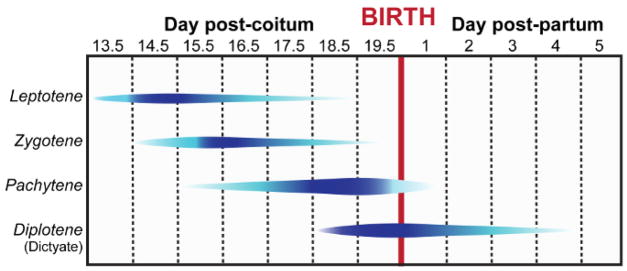
Figure 1. Meiotic prophase timeline during female embryonic and neonatal development.
Blue contours indicate populations of specific prophase sub-stage germ cells (leptotene, zygotene, pachytene, and diplotene/dictyate stages) observed during embryonic and neonatal development. Increasing dark blue color indicates the timing at which the specific prophase sub-stage becomes more abundant. This figure was adapted from reference2. Please click here to view a larger version of this figure.

