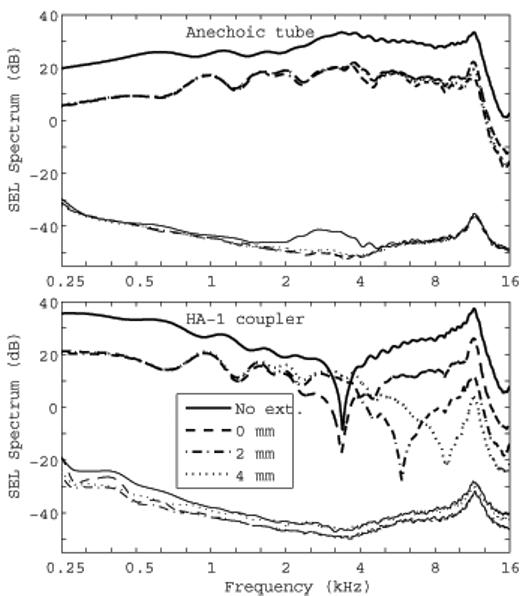
FIG. 1.

Comparison of click spectra measured in the anechoic tube (top panel) and in a 2-cm3 (HA-1) coupler (bottom panel). In each panel the thicker lines towards the top show the signal SEL spectrum and the thinner lines near the bottom show the noise SEL spectrum. The noise SEL is the standard error of the mean and is extremely low due to the large number of averages (N = 4050). The legend indicates the length of the ER-10B+ extension tube associated with each spectra, or “No ext.” for the no-extension condition, which is the subsequent default configuration of the ER-10B+ used in the study.
