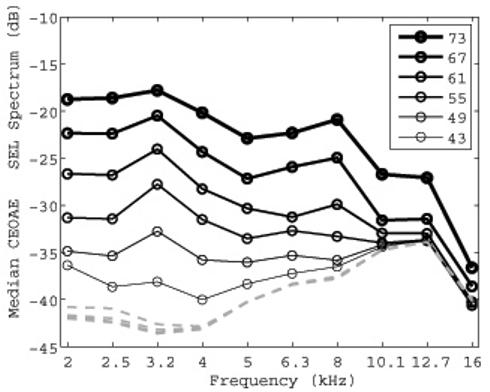
FIG. 4.

Median CEOAE SEL spectra (1/3 octave average) for each of 6 click stimulus levels are plotted with increasing line thickness for increasing stimulus level. The peSPL of each click stimulus is specified in the legend. The median noise SEL spectra (1/3 octave average), are also plotted (dashed lines). The line thickness is the same for the noise levels because they had no level dependence.
