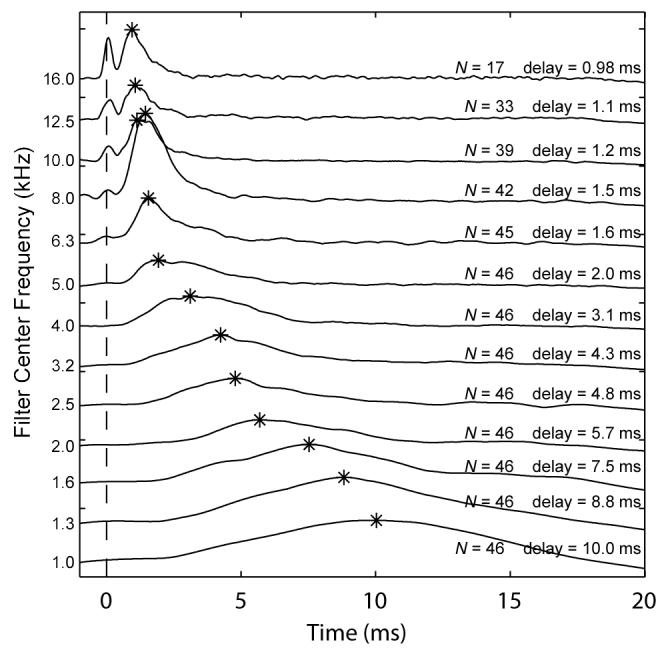
FIG. 6.

Mean 1/3-octave filtered CEOAE waveform envelopes as a function of time. Data are from the highest stimulus level used (73 dB peSPL). Tracings are offset on the y-axis for clarity and arranged by filter center frequency in decreasing order. Only recordings with a SNR > 3 dB were included in the averages. The number of ears (N) included in the mean is indicated for each tracing. The vertical dashed line indicates the stimulus onset. The peak of each envelope is indicated by an asterisk, and the corresponding delay (in ms) relative to stimulus onset is also displayed.
