
Fig. 1.
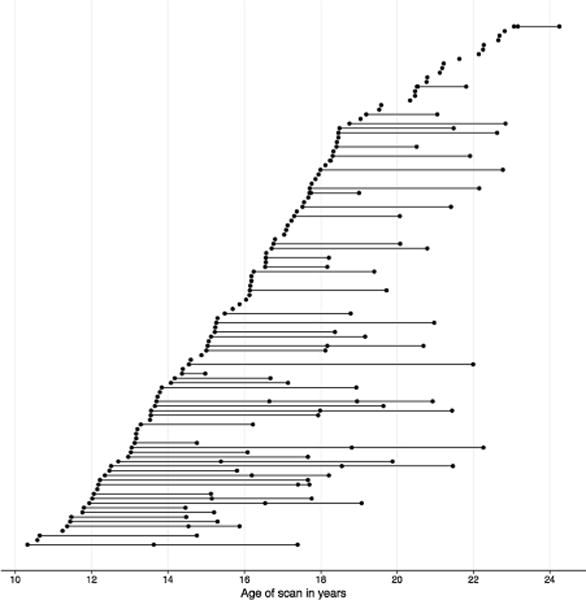
Distribution of participant ages for scans with usable data. Each scan is represented by a circle; scans from the same participant are connected with a line.
Official websites use .gov
A
.gov website belongs to an official
government organization in the United States.
Secure .gov websites use HTTPS
A lock (
) or https:// means you've safely
connected to the .gov website. Share sensitive
information only on official, secure websites.
Distribution of participant ages for scans with usable data. Each scan is represented by a circle; scans from the same participant are connected with a line.