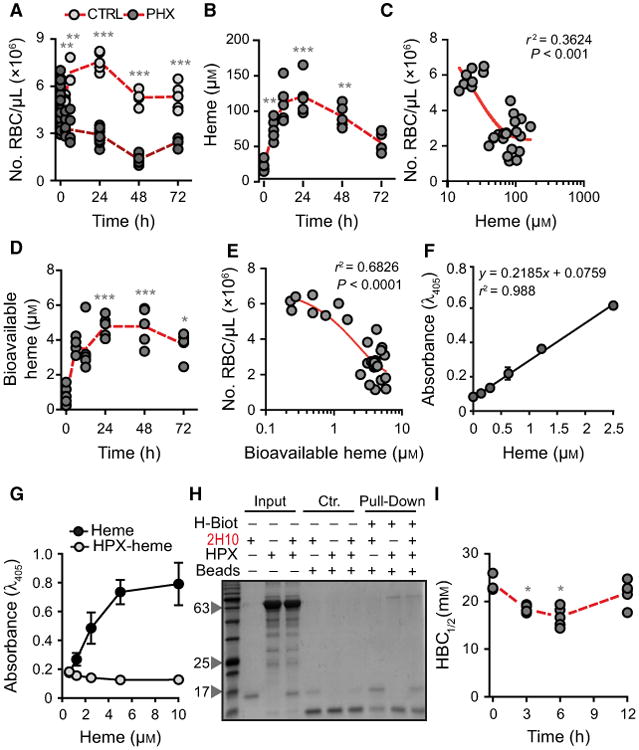
Fig. 6.

Characterization of labile heme in plasma following acute hemolysis. (A) Number of RBC in C57BL/6 mice receiving Phenylhydrazine (PHX) and control (CTRL) mice receiving PBS. (B) Heme concentration in the plasma of C57BL/6 mice receiving phenylhydrazine. (C) Correlation between circulating RBC numbers (data from A) and heme concentration in plasma (data from B). (D) Concentration of bioavailable heme in plasma of C57BL/6 mice receiving phenylhydrazine, quantified by a heme reporter assay [31]. (E) Correlation between circulating RBC numbers (data from A) and concentration of bioavailable heme in plasma (data from D). (F) Soluble hemin quantified by a sandwich ELISA in which the sdAbs 1A6 and 2H7 are used to capture and reveal heme, respectively. (G) Detection of soluble heme versus heme bound to HPX using the same sdAb-based ELISA as in (F). Note that heme bound to HPX is not detected by ELISA. (H) A pull-down assay using streptavidin-beads to capture heme-biotin. The sdAb 2H10 bound to heme-biotin was added to HPX at 1/6 SdAb/HPX molar ratio. Streptavidin-beads pulled down the sdAb 2H10 as well as HPX bound to heme-biotin, demonstrating that HPX can bind heme-bound to sdAb 2H10. This is consistent with the higher affinity of HPX toward heme as compared to the sdAb 2H10. Coomassie-based stain of 15% SDS/PAGE gel loaded with streptavidin-beads used to pull-down heme-biotin from different reaction mixtures. Grey arrowheads indicate the molecular weight of the protein ladder (NZYColour Protein Marker II, Nzytech®) in kDa loaded in the first lane of the gel. Gel is representative of two independent experiments with similar trend. (I) Plasma HBC1/2 in C57BL/6 mice receiving phenylhydrazine. Circles in A, B, C, D, E, and I correspond to individual mice. Red dash line represents mean ± STD. *P < 0.05, **P < 0.01, ***P < 0.001 versus time 0, calculated by ANOVA and Dunns post-test.
