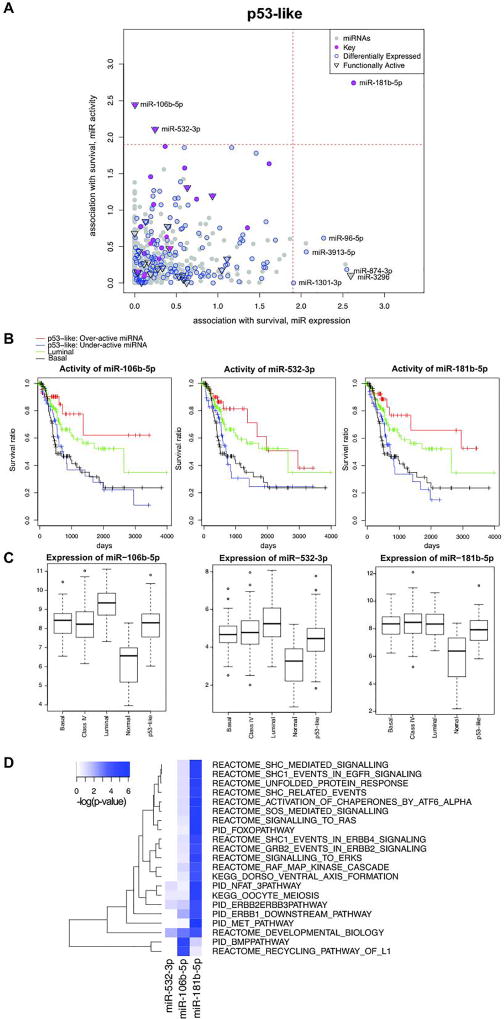
Figure 3. Prognositc key miRNAs of p53-like subtype.
(A) Survival analysis based on p53-like subtype of BLCA TCGA samples. Survival prognosis by miRNA activity (y-axis) and expression level (x-axis), using a log-rank test was shown. The magenta dot represented key miRNAs, the blue circle represented differentially expressed miRNA, and point down triangle represented functionally active. (B) Kaplan-Meier survival curve based on the activity of miR-106b-5p, miR-532-3p, and miR-181b-5p. The blue and red curve represented under and over active group among p53-like subtype. The green and black curve represented luminal and basal subtypes, respectively. (C) Expression level of miR-106b-5p, miR-532-3p, and miR-181b-5p for each tumor subtypes and adjacent normal samples. (D) Functional annotation of prognostic and key miRNAs’ functional targets based on canonical pathways. Heatmap of pathway enrichment of functional target genes of each miRNA for p53-like subtype of BLCA TCGA data is shown. The color represented –log(P-value) of enrichment based on FET. The displayed pathways are significantly enriched for target genes of at least one miRNA.

