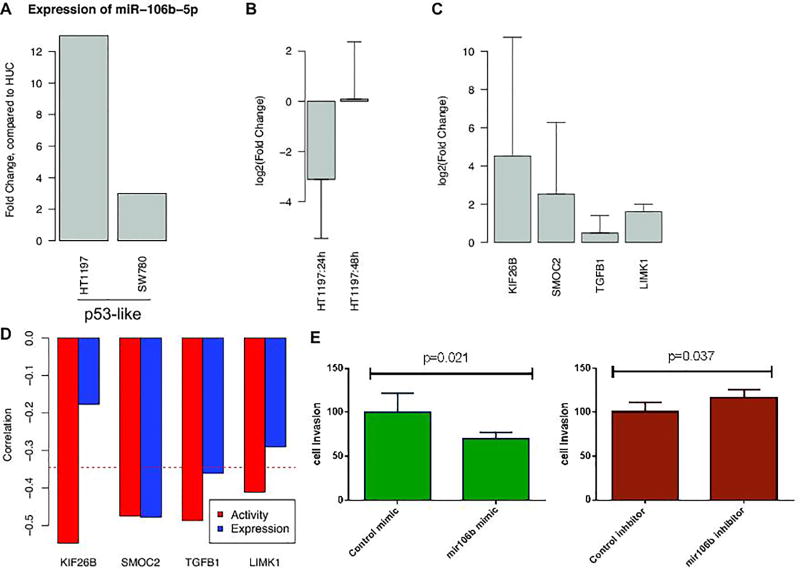
Figure 5. Experimental validations of miR-106b-5p.
(A) Expression levels of miR-106b-5p for each cell line. Fold changes compared to HUC are shown for each cell line. (B) log2 transformed fold changes after treatment of miR-106b-5p specific anti-miR inhibitor after 24h and 48h. (C) The expression changes of target genes after inhibition of miR-106b-5p expression. Comparison of qPCR results of the control and miR-106b-5p inhibitor confirmed that miR-106b-5p regulated the gene expression levels of its predicted target genes. (D) The Pearson correlation between target genes of each miRNAs and miRNA expression (blue) or miRNA activity (red). Even through the expression level of miR-106b-5p did not correlated with the expression levels of their target genes KIF26B and LIMK1, the inferred miRNA activities of miR-106b-5p significantly correlated with the expression levels of KIF26B and LIMK1. (E) Cell invasiveness was measured when overexpressing or knockdown miR-106b-5p with the miR-106b-5p specific mimic or inhibitor relative to corresponding controls in HT1197. The miR-106b-5p specific inhibitor significantly increased cell invasiveness (p=0.037) while the miR-106b-5p specific mimic significantly decreased cell invasiveness (p=0.021). All error bars indicate 95% confidence Interval.

