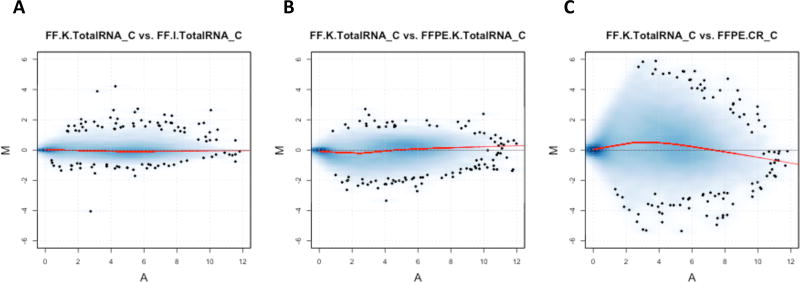
Figure 3.
MA-plot of 20,381 CR targeted poly(A)+ genes for tumor sample C when using FF.K.TotalRNA sample C library as the reference. A) MA plot for tumor C between FF.K.TotalRNA and FF.I.TotalRNA; B) MA plot for tumor C between FF.K.TotalRNA and FFPE.K.TotalRNA; C) MA plot for tumor C between FF.K.TotalRNA and FFPE.CR. M is the log2-transformed expression of a gene from first library divided by that from the second library, while the A is the mean log2-transformed expression of the gene. The red curve indicates the lowess smoother fitted to the data. Abbreviation: MA-plot, difference in measurements as log ratio (M) versus mean average expression (A) of each gene.

