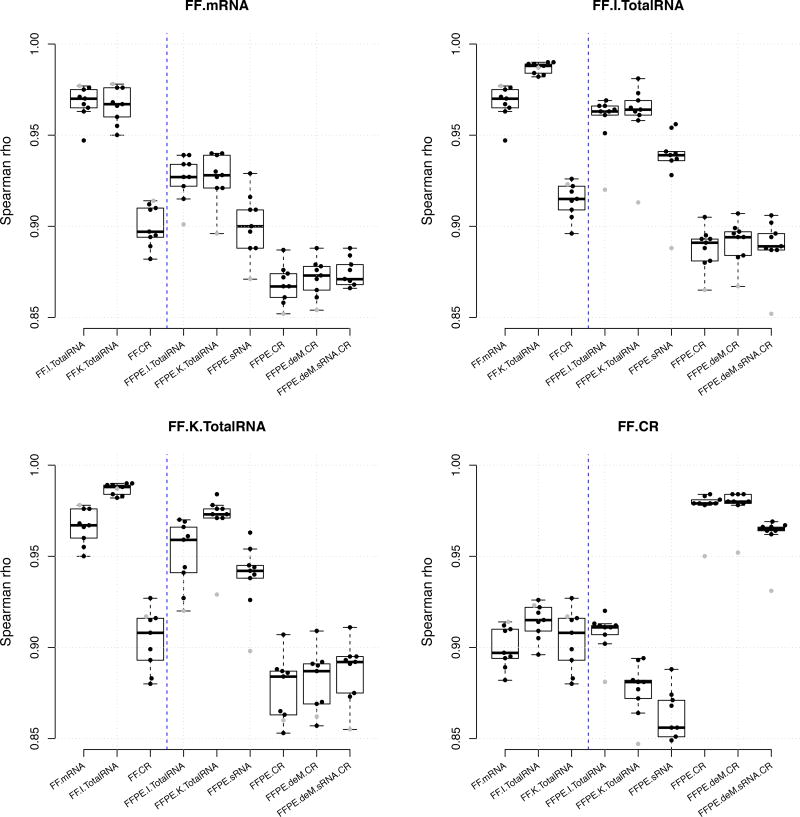
Figure 4.
Summary of between-protocol correlation coefficients based on TPM. The main title of each figure is the reference protocol used for comparison. Each dot is the Spearman rho estimate calculated between the reference library and the library showing on the × axis. Each box summarizes the Spearman rho estimates from nine breast tumor samples. The gray dot indicates the tumor sample N.

