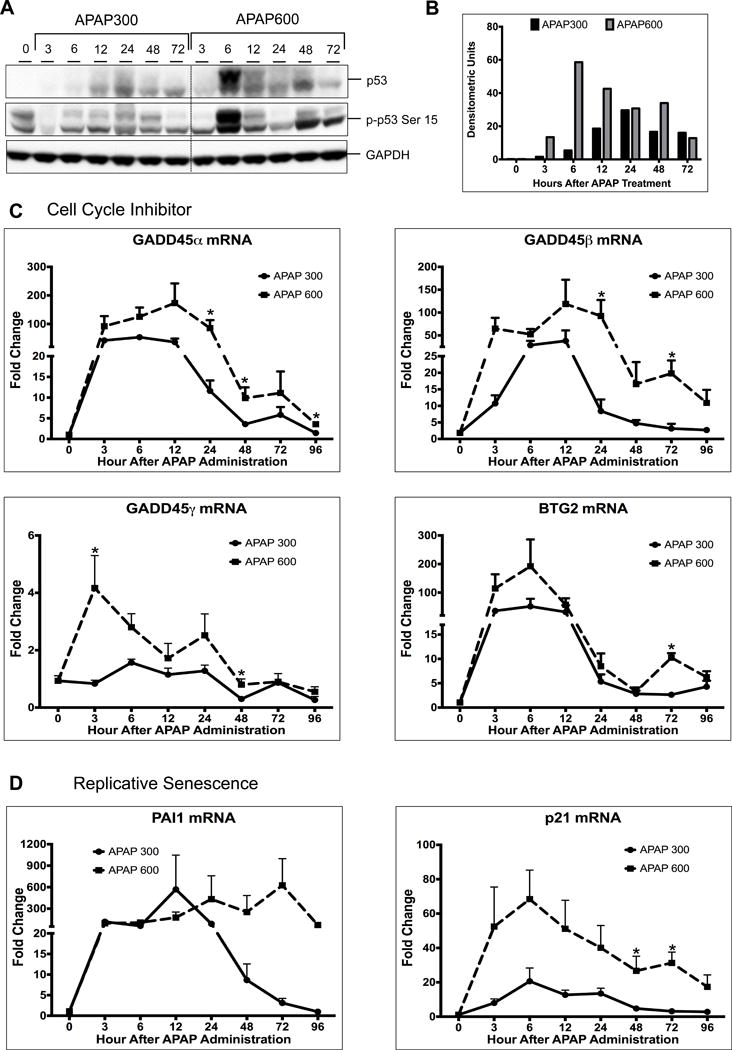
Figure 4.

Activation of p53 is higher following APAP600 treatment. (A) Western blot analysis of total p53 and phospho-p53 Ser15 using total liver extract (B) Bar graph showing densitometric analysis of total p53 Western blots (C) Real time PCR analysis of p53 target genes regulating cell cycle inhibition Gadd45α, Gadd45β, Gadd45γ, and BTG2 (D) replicative senescence PAI1. *p<0.05 (APAP300 vs APAP600)
