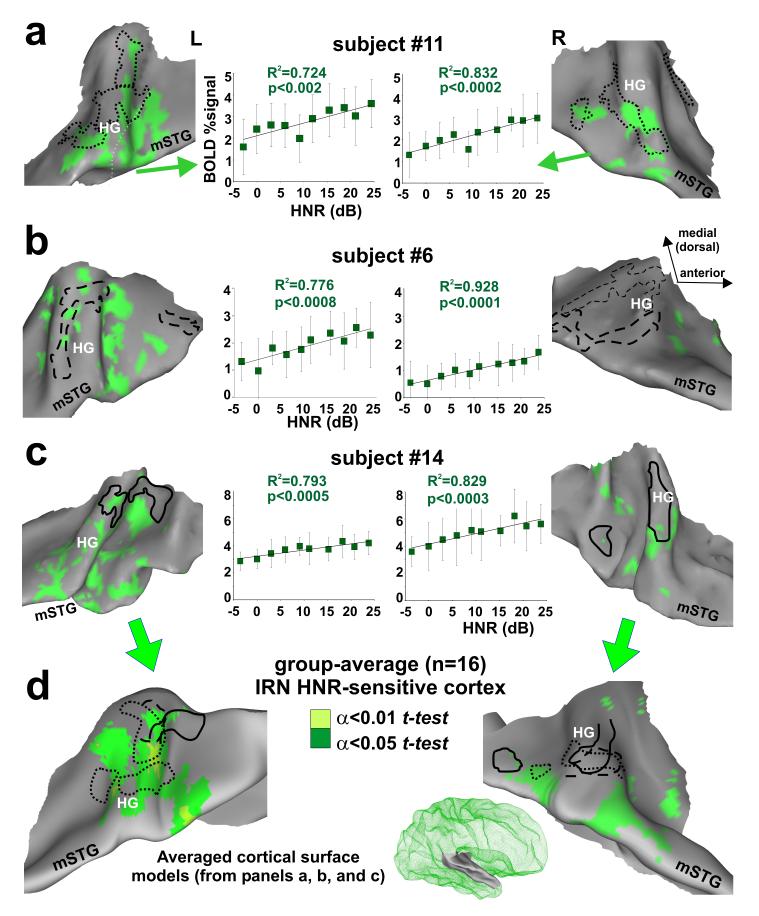
Figure 3.
Cortex sensitive to the degree of harmonic structure of iterated rippled noises (IRNs). (a-c) Individual data sets showing location of IRN HNR-sensitive cortical foci (α<0.05, corrected) relative to the location of FDRRs specific to each individual (dotted, dashed, and solid outlines from Fig. 2). Charts show the linear correlation between HNR value and BOLD activity (percent signal change relative to silent events) combined across the multiple foci along Heschl’s complex and the mSTG (mean plus s.d.). The 180 IRN data points were binned at 3 dB HNR intervals for clarity. (d) Group-average overlap of HNR-sensitive cortex after thresholding each individual data set (individual α<0.05, and two t-test levels, α<0.05 and α<0.01, corrected) and projected onto averaged brain surface models derived from these three participants ( right hemisphere model shown in green mesh inset).

