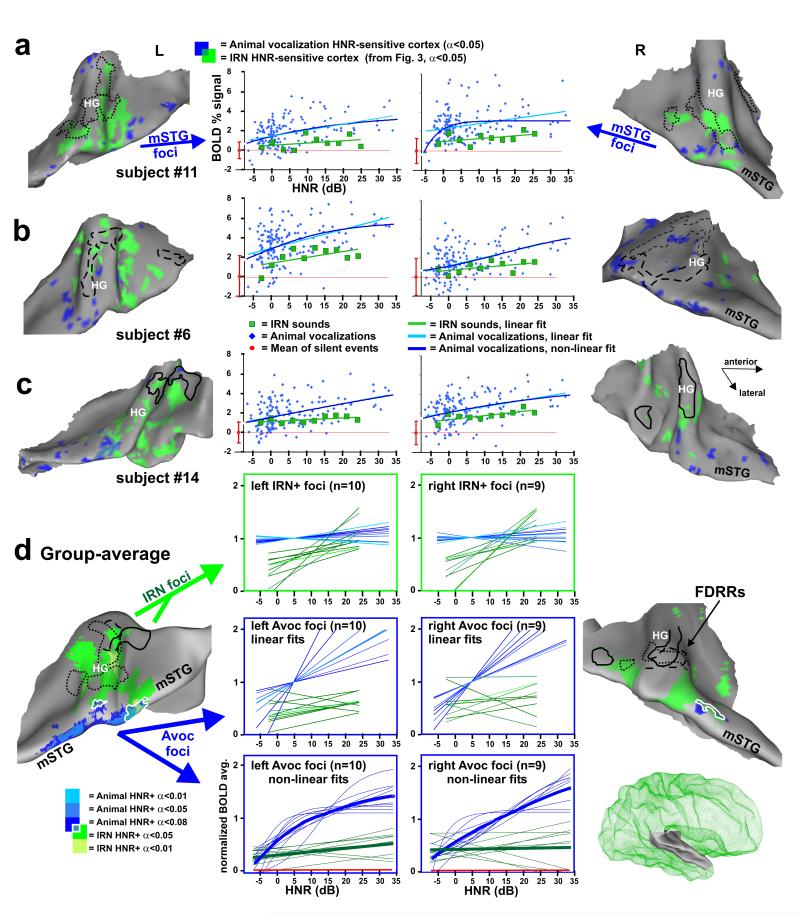
Figure 4.
Cortex sensitive to the degree of harmonic structure of animal vocalizations. (a-c) Individual cortical maps illustrating animal vocalization HNR-sensitive cortex (blue), based on a linear regression model. IRN HNR-sensitive foci (green) and FDRR outlines (black) are from Fig. 3. Charts show the relation between HNR value and BOLD signal from the animal vocalization foci (blue) and IRN HNR-sensitive foci (green). The IRN data depicted in the charts were the control stimuli from paradigm #4 (as opposed to the data from paradigm #3 in Fig. 3), allowing for a direct comparison of relative activation response magnitudes (BOLD signal). All data are in percent BOLD signal change relative to the mean responses to silent events (red dot at zero, mean plus s.d.). (d) Group-averaged maps of HNR-sensitive cortex to animal vocalizations (n=11, blue: t-tests, see color key) and to IRN stimuli (green, from Fig. 3d) on the averaged surface model from Fig. 3. White outlines encircle regions of overlap between IRN and animal vocalization HNR-sensitive regions. In the charts, thin curves are those from different individuals, normalized to the mean BOLD response within each ROI defined by the animal vocalization data. Not all participants showed significant bilateral activation (n=10 left, n=9 right hemisphere). Thick curves show the respective response averages. Some hemispheres revealed foci showing a significant negative, linear correlation with HNR value of the IRN and/or animal vocalizations (data not shown). When present, these foci were typically located along the medial wall of the lateral sulcus, and were more commonly observed in the right hemisphere. However, these negatively correlated HNR-sensitive foci were not significant in the group-averaged data.

