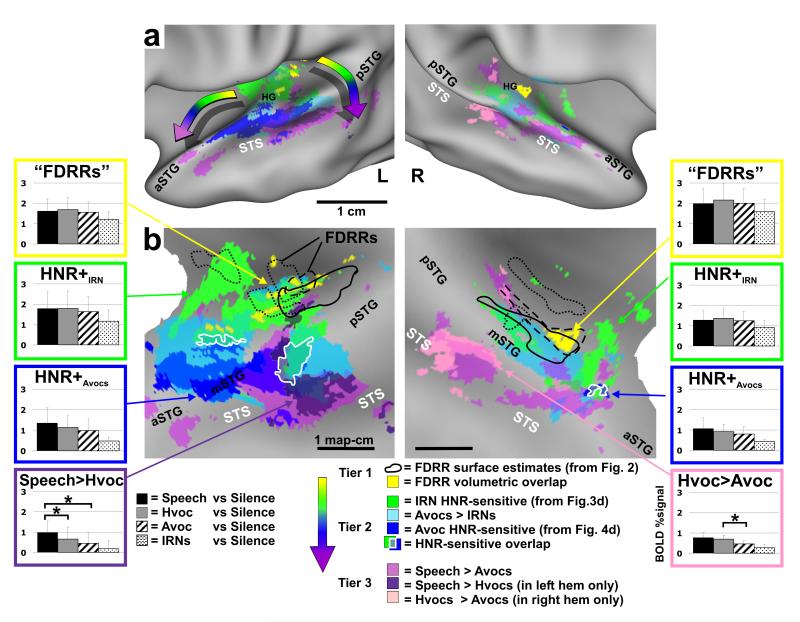
Figure 5.
Location of HNR-sensitive cortices relative to human vocalization processing pathways and FDRRs. Data are illustrated on slightly inflated (a) and “flat map” (b) renderings of our averaged cortical surface models. Volumetric averages of FDRR (yellow) and volumetrically-aligned FDRR boundary outlines (black) were derived from data in Fig. 2. HNR-sensitive data are from Fig. 4d. Data from paradigm #5 (Speech, Hvoc, Avoc, IRN) are all at α<0.01, corrected. Refer to key for color codes. Intermediate colors depict regions of overlap. The “rainbow” arrows in panel a depict two prominent progressions of processing tiers showing increasing specificity for the acoustic features present in human vocalizations. Overlap of IRN and animal vocalization HNR-sensitivity are indicated (white outlines). Histograms from several ROIs show group-averaged response magnitudes (mean plus s.d.) to each of the four sound categories used in paradigm #5 (refer to text for other details).

