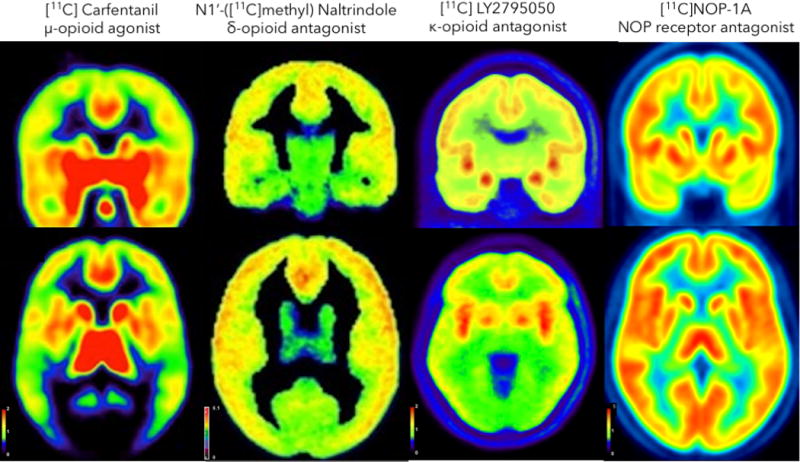
Figure 2.

Positron Emission Tomography (PET) baseline measures of opioid receptor binding in humans [images averaged across a group of subjects (n<20 for all groups)]. Images are color-coded according to the scale shown so that highest concentrations of the radiotracer are represented by red and lowest concentrations by black/purple. Binding maps in the coronal (top) and axial (bottom) view show greatest binding in the striatum and insular cortex for all radiotracers, except for the δ-opioid receptor antagonist: N1′-([11C]methyl) Naltrindol.
Left: μ-opioid receptor agonist: [11C]; Carfentanil; δ-opioid receptor antagonist: N1′-([11C]methyl) Naltrindol; κ-opioid receptor antagonist: [11C] LY2795050; nociceptin receptor: [11C]NOP-1A.
Reproduced with permission137–139. NOP receptor agonist: [11C]NOP-1A, images provided by Rajesh Narendran.
