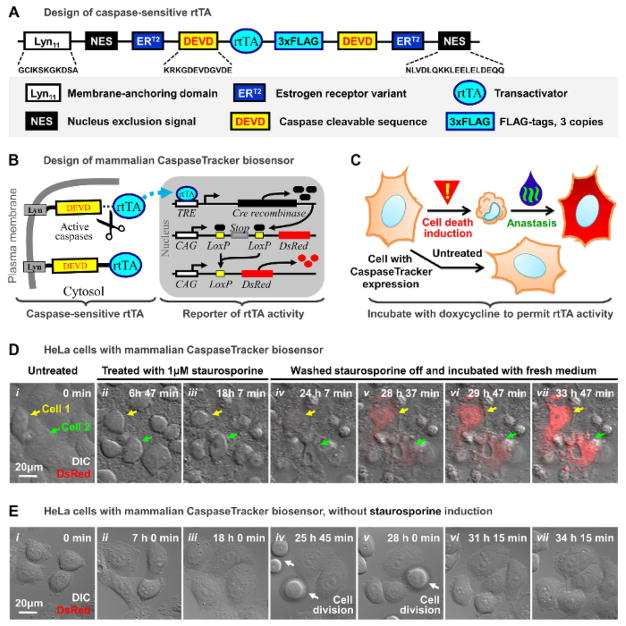
Figure 2. Mammalian CaspaseTracker biosensor system.
(A) Schematic diagram of the caspase-sensitive rtTA.
(B) Schematic diagram of the mammalian CaspaseTracker rtTA biosensor system.
(C) Flowchart of using the CaspaseTracker rtTA biosensor system to detect anastasis. Red/yellow triangle (apply cell death inducer) and green/ blue (wash inducer off) symbols are as in Figure 1A.
(D) Time-lapse live cell confocal microscopy of a cluster of HeLa cells expressing the mammalian CaspaseTracker rtTA biosensor before (i), and during exposure to 1μM staurosporine (ii – iii), and after removing staurosporine from the culture medium (iv – vii). Merged images of DIC and DsRed signals. Arrows indicate the cell 1 (yellow) and cell 2 (green).
(E) Time-lapse live cell confocal microscopy of the untreated biosensor-expressing HeLa cells. Merged images of DIC and DsRed signals. White arrows indicate dividing cells.
Doxycycline (1ug/mL) was present in the medium throughout the experiments shown in panels (D) and (E). Please click here to view a larger version of this figure.

