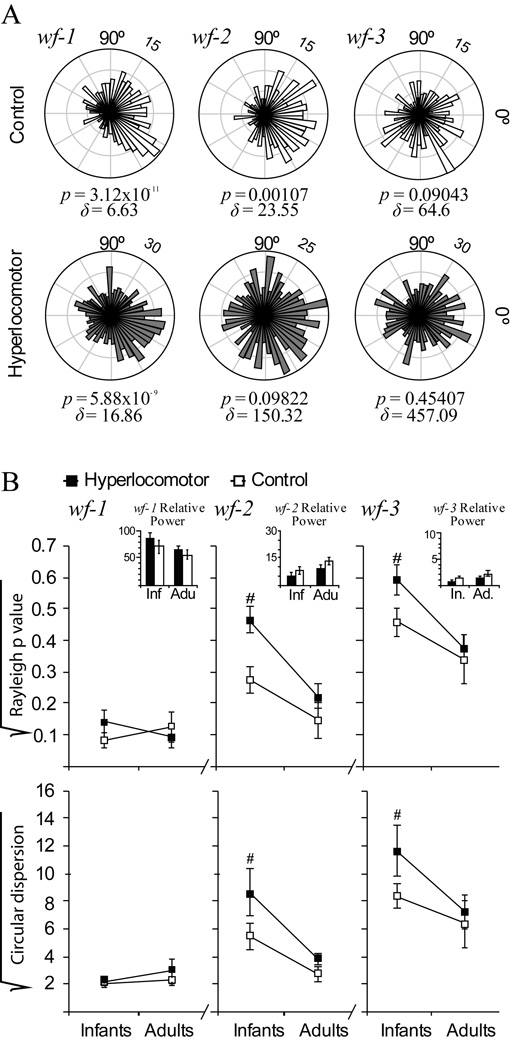
Figure 5. Striatal neuron spiking was less phase-locked to cortical local field potential in infant hyperlocomotor mice.
To assess phase locking of striatal discharges to cortical rhythms, we used wavelet decomposition to generate three non-overlapping band-passed LFP waveforms, wf-1, wf-2 and wf-3, retaining different main frequency components of the LFP corresponding to the slow oscillation, delta waves and spindles, respectively (see Figure 2D). Phase locking was defined as a significant deviation from uniformity (Rayleigh p< 0.05) in circular plots depicting the number of spike occurrences (radial axis) at every waveform angle (circular axis; bin size: 7.2 degrees). Circular dispersion was taken as an additional index of locking strength. A. Circular plots corresponding to representative control (above) and hyperlocomotor (below) infant mice striatal neurons. The control mouse neuron was significantly locked to wf-1, wf-2, and wf-3 whereas the neuron from a hyperlocomotor mouse was locked to wf-1 only. Rayleigh p values (p) and circular dispersion (δ) are provided below each plot. B. Average Rayleigh p value and circular dispersion for control and dopamine neuron depleted mice, in infancy and adulthood, depicted separately for wf-1, wf-2 and wf-3 (mean ± SEM; values were square root transformed for normalization). Statistical comparisons were made with three way ANOVAs, separately for Rayleigh p values and circular dispersion, with two between group factors (treatment and age) and one within group factor (band). There were significant main effects of age (p=0.001) with significant band per age interactions (p<0.001). Therefore, we computed the simple effects of age, regardless of treatment, which indicated that circular distributions within wf-2 and wf-3 were more skewed in adult than infant mice (Tukey post hoc test, p<0.01 either for wf-2 or wf-3). Also, there were significant main effects of lesion or lesion per band interaction, owing to lesion effects within wf-2 and wf-3 at infancy (p<0.05 in Tukey post-hoc comparisons within the different bands and ages). Insets depict the power (mean ± SEM) of the corresponding LFP band for each group and age, showing that, for the segments of signal studied, there were no differences in LFP power. Data are from set one. Number of neurons per group: infant controls, 53, infant hyperlocomotor, 49, adult controls, 20, lesioned adults 37. There were no between group differences in the number of spikes per neuron used for the computations (mean ± SEM for the whole population of neurons, 194.7 ± 23.1).

