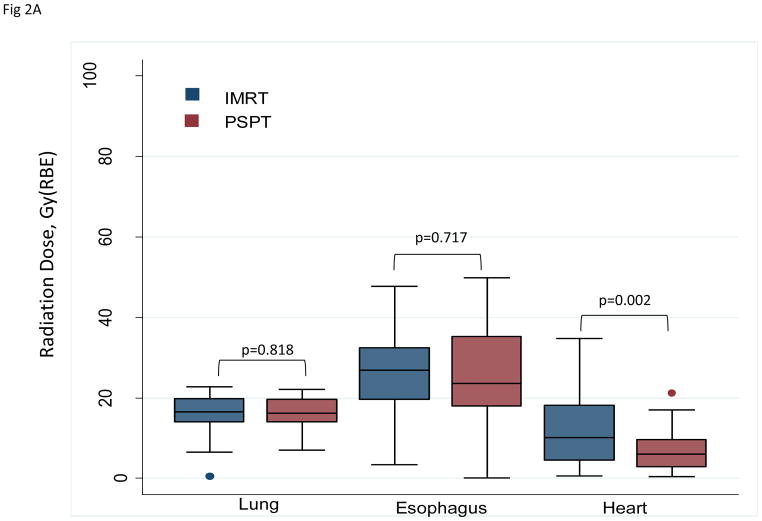
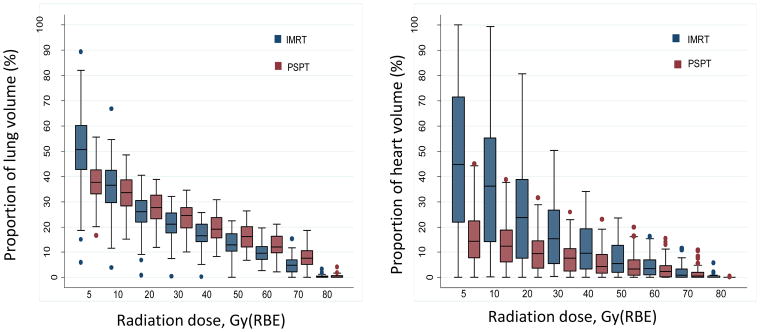
Figure 2.
A, Box-and-whiskers plot of mean radiation doses to the lung, esophagus, and heart. Mean doses to the lung and esophagus were no different between the two treatment groups (intensity-modulated radiation therapy [IMRT] and passive scatter proton therapy [PSPT]), but the mean heart dose was lower for those treated with protons (P=0.002). Whiskers indicate 1.5 times the interquartile range above and below the boxes; dots represent outliers. B, Box-and-whiskers plot of distributions of dose–volume indices for the lung (right) and heart (left). The y axis is the percentage of the organ at risk (lung or heart) that received the indicated radiation dose in Gy(RBE) on the x axis. PSPT led to smaller volumes of lung being exposed to low doses (V5–V10) and larger volumes of lung exposed to ≥20 Gy(RBE). Conversely, PSPT reduced the volume of heart exposed to all dose levels measured (5–80 Gy(RBE)). Whiskers indicate 1.5 times the interquartile range above and below the boxes; dots represent outliers.


