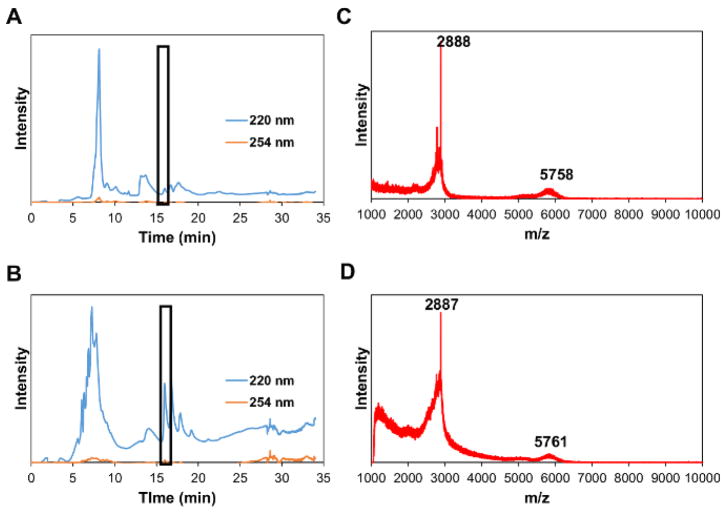
Figure 2.
HPLC chromatogram at 220 nm (wavelength of peptide bonds) and 254 nm (tyrosine wavelength) of DSPE-PEG(2000)-MCP-1 (A) and DSPE-PEG(2000)-scrambled (B). (Boxed peak at 16.9 min). (C) MALDI-TOF mass spectrum of DSPE-PEG(2000)-MCP-1 at a range of 1,000–10,000 Da showing the peaks for [M+H]+ at m/z 2,888 (expected 2,890) for MCP-1 and m/z 5,758 (expected 5,760) for DSPE-PEG(2000)-MCP-1. (D) MALDI-TOF mass spectrum of DSPE-PEG(2000)-scrambled at a range of 1,000–10,000 Da showing the peaks for [M+H]+ at m/z 2,887 (expected 2,890) for scrambled peptide and m/z 5,761 (expected 5,760) for DSPE-PEG-scrambled. Please click here to view a larger version of this figure.

