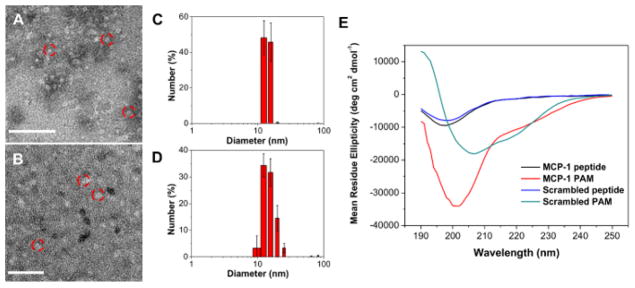
Figure 3.
TEM images of MCP-1 PAM (A) and scrambled PAM (B). Scale bar = 100 nm. Number-average size distribution of MCP-1 PAM (C) and scrambled PAM via DLS (D). Data are mean ± S.D. (n = 3). (E) CD analysis of MCP-1 and scrambled peptides and PAMs (n = 3). Please click here to view a larger version of this figure.

