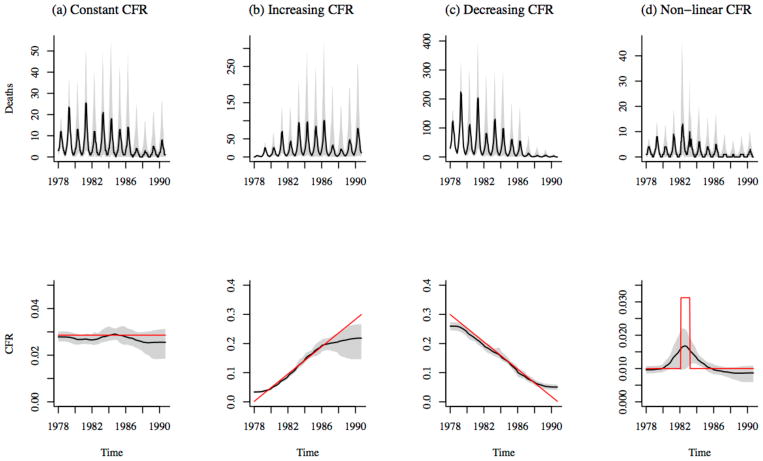
Figure 3.
Estimates of CFR using spline regression (with 5 degrees of freedom) of cumulative births on cumulative simulated deaths. Stochastic simulations of deaths are shown in the top panel of plots. Black line shows the median of 500 simulations; the shadowed region corresponds to the range between the 10th and 90th percentiles of the simulations. Deaths were simulated assuming four scenarios: (a) constant CFR = 0.02; (b) linearly increasing CFR over the time period, c) linearly decreasing CFR over the time period, and d) non-linear CFR with an increase in the middle of the time period. The bottom panel of plots shows median estimated CFR in black; the shadowed region corresponds to the range between the 10th and 90th percentiles of the estimates. Red line indicates the actual CFR assumed for each simulation scenario.

