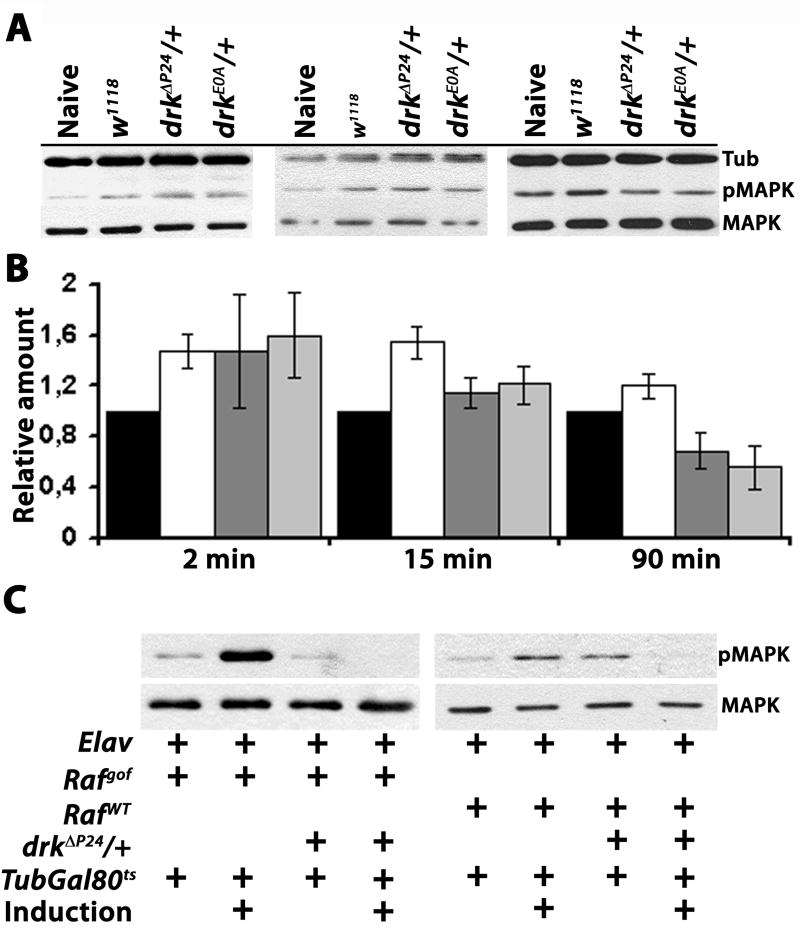
Figure 6. Impaired MAPK activation in drk mutant heterozygotes.
(A) Representative western blots probing the level of phosphorylated MAPK (pMAPK) in comparison to total levels of the protein (MAPK) following associative conditioning as detailed in Materials and Methods. The level of Tubulin in each of the indicated control and mutant head lysates was used to normalize protein levels in each lane and for quantification. Lysate from a single head equivalent was loaded per lane. Naïve denotes lysates from w1118 animals that underwent all manipulations in parallel except for associative learning. Blots from animals allowed to rest 2 minutes, 15 minutes or 90 minutes post-training (as indicated in the graph below n B), followed by lysate preparation are shown left to right.
(B) The mean and its standard error from at least 3 independent determinations of the relative amount of pMAPK to that of MAPK in the samples is shown. The levels of pMAPK and MAPK were determined relative to Tubulin to normalize loading differences. This ratio for naïve animals was fixed to 1. ANOVA did not indicate significant differences among the samples obtained 2 minutes after training (F(3,19)=1.350, p<0.29, n=4). In contrast, differences among the samples obtained 15 minutes post-training were significant (F(3,15)=3.998, p<0.03, n=3). Subsequent pairwise t-tests showed significant difference from naive only for wild type flies (p<0.009), but not for drkΔP24/+ or drkE0A/+ (p<0.45 and p<0.29 respectively). Contrast analysis showed that w1118 pMAPK levels were significantly different from drkΔP24/+ and drkE0A/+ (p<0.02). 90 minutes post-training, ANOVA indicated significant effects of genotype (F(3,17)= 7.638 p<0.003, n=4). Pairwise t-tests showed that wild type pMAPK levels were not different from that in naïve animals (p<0.16) indicating that MAPK phosphorylation returned to naive levels. In contrast, pMAPK levels in drkΔP24/+ and drkE0A/+ were different (lower) that in naïve flies (p<0.04 and p<0.01 respectively). Contrast analysis also showed that pMAPK levels in w1118 were significantly higher than those in drkΔP24/+ and drkE0A/+ (p<0.004).
(C) Western blots probing the level of pMAPK in single dissected brains of naïve flies carrying Rafgof (left side), or RafWT (right side) transgenes in control (w1118), or drkΔP24/+ mutant background, with of without transgene induction by incubation at 30°C as indicated by the crosses. The pMAPK level is elevated upon Rafgof and to a lesser degree RafWT expression in w1118, but not when the flies are heterozygous for the drkΔP24 null allele. Quantification of the levels revealed highly significant differences between controls and drkΔP24/+ upon Rafgof (F(1, 6)= 354, p<0.001, n=3) and upon RafWT (F(1,6)= 7.85, p<0.04, n=3) expression.

