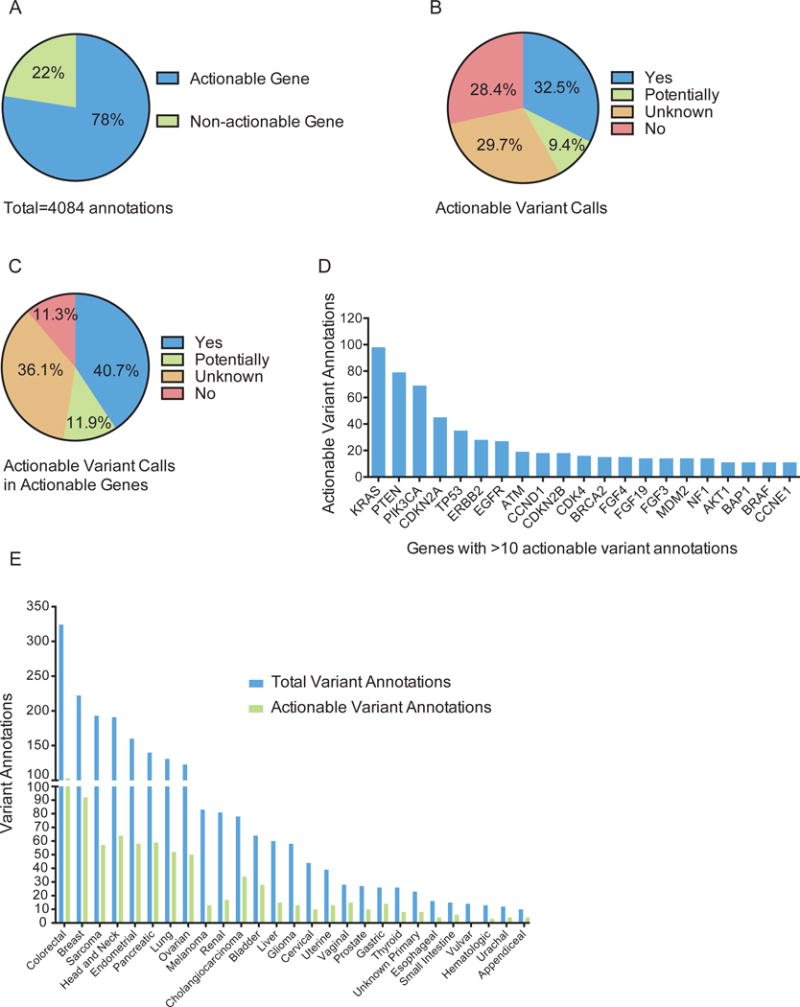
Figure 2.

Actionable genes and variants reported. (A) The percentage of annotations provided in an actionable or non-actionable gene, as defined at the time of annotation. (B, C) The percentage of annotations delivered with the indicated actionable variant calls for all (B) or only actionable (C) genes. (D) The number of actionable annotations provided within each specified gene (minimum of 10 actionable annotations per gene). (E) The total number of annotations provided with an actionable variant call (blue bars) and the subset that are actionable (green bars) is shown per tumor type for types with at least 10 annotations.
