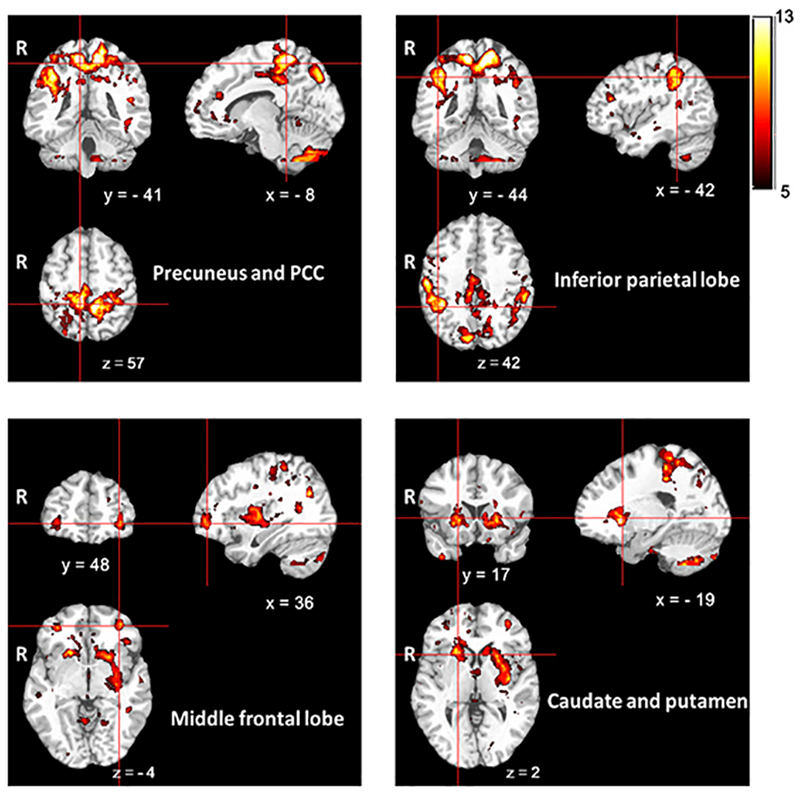
Figure 2.

Overlapped clusters from all individual CKD subjects with positive extrema in CBF in the subject-specific voxel-wise analysis. The color bar indicates the total number of subjects who had subject-specific clusters with increased CBF. R: right. x, y, z: coordinates in Monteal Neurological Institute (MNI) space.
