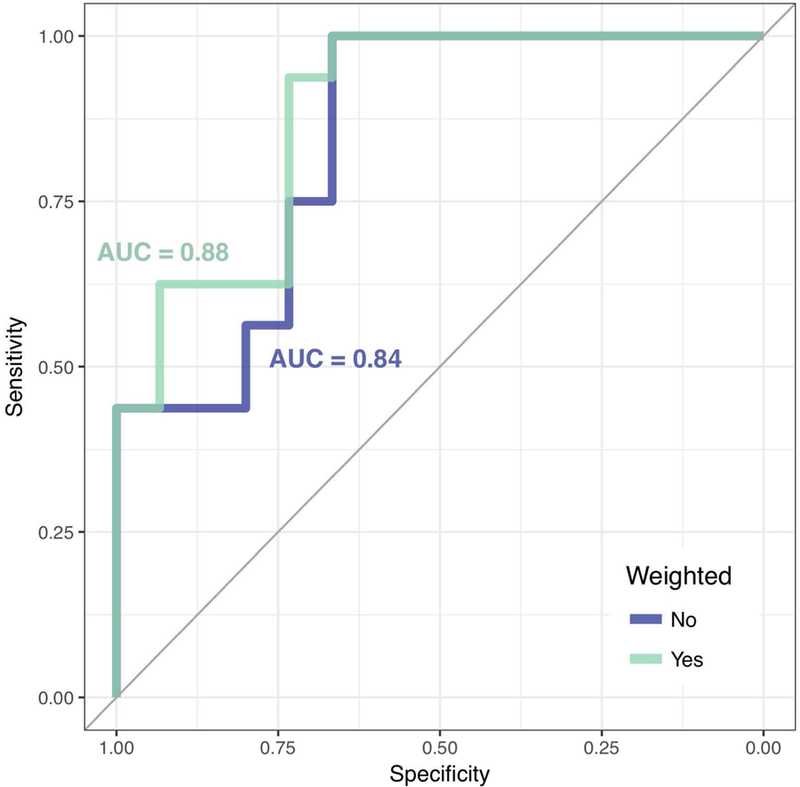
Figure 3:

Receiver operating characteristic (ROC) curves of MS diagnosis based on patient-level automated CVS biomarker scores. The ROC curve for the unweighted biomarker is shaded blue, and the ROC curve for the weighted biomarker is shaded green. The AUC values for both curves are displayed in their respective colors.
