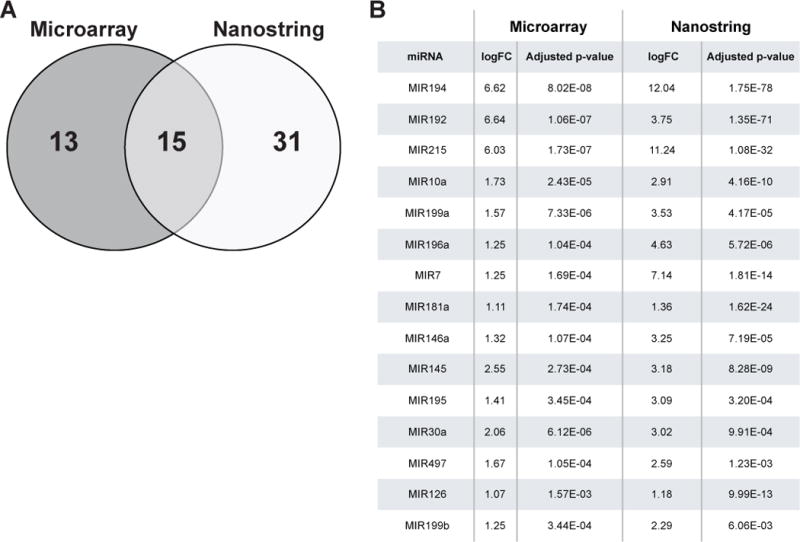
Figure 2. Upregulated miRNAs from cross-platform analysis.

(A) Venn diagram showing upregulated miRNAs detected by Agilent microarray and Nanostring profiling in Selection sample sets A and B respectively. Detailed fold changes for each upregulated miRNA listed in SupTable 2 and 3. 15 consensus miRNAs were determined by cross-referencing of miRNAs detected by each platform. Log of fold changes (logFC) and adjusted p-values of these 15 miRNAs are listed in (B), ranked by mean of adjusted p-value.
