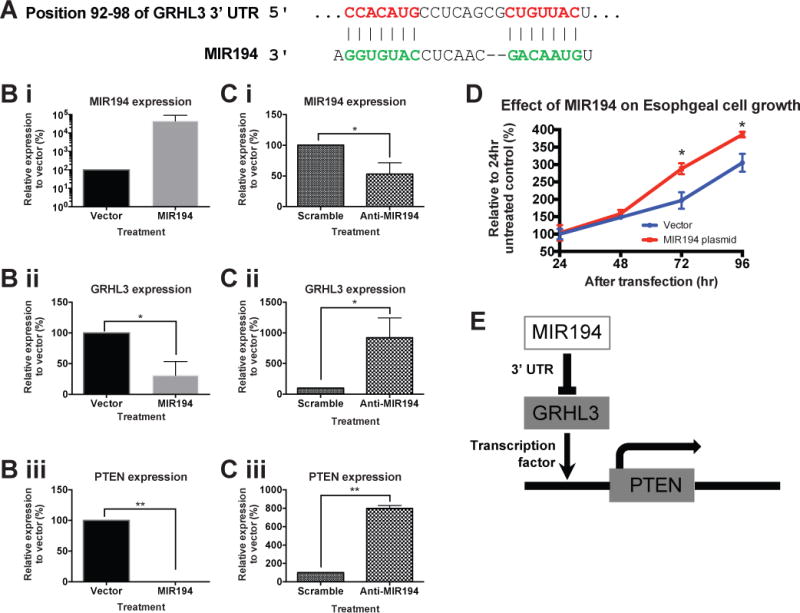
Figure 5. Dysregulated MIR194 expression drove cell proliferation in vitro through MIR194-GRHL3-PTEN axis.

(A) Genomic alignment of GRHL3 mRNA 3′UTR with MIR194. Normal esophageal cell line NES were transfected with either MIR194 plasmid (B) or anti-MIR194 (C). Relative expression of MIR194 (i), GRHL3 (ii) and PTEN (iii) in NES cell line was examined by qRT-PCR. Error bars show standard deviation of the mean: *, p<0.05; **, p<0.01. (D) Cell growth was determined by trypan blue exclusion assays every 24 hours for a period of 96 hours after MIR194 transfection relative to vector control. Error bars show standard deviation of the mean: *, p<0.05. (E) Diagram shows MIR194-GRHL3-PTEN cascade network.
