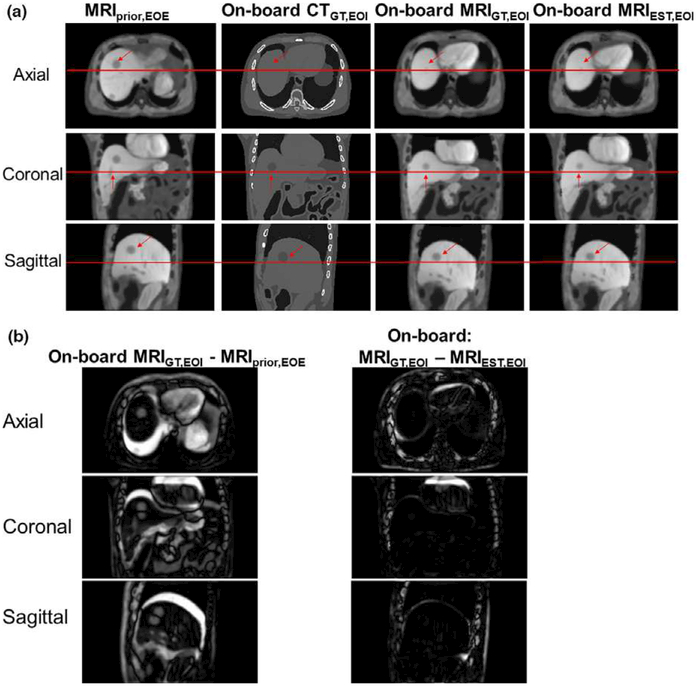
FIG. 3.
(a) The columns from left to right are the following. MRIprior at EOE phase, ground-truth CT at EOI phase, ground-truth on-board MRI at EOI phase and estimated on-board MRI at EOI phase for XCAT Scenario 2. The rows represent axial, coronal, and sagittal views, respectively. The horizontal line and arrows indicate areas for comparison. (b) Subtraction images for axial, coronal, and sagittal images shown in (a). [Color figure can be viewed at wileyonlinelibrary.com]

