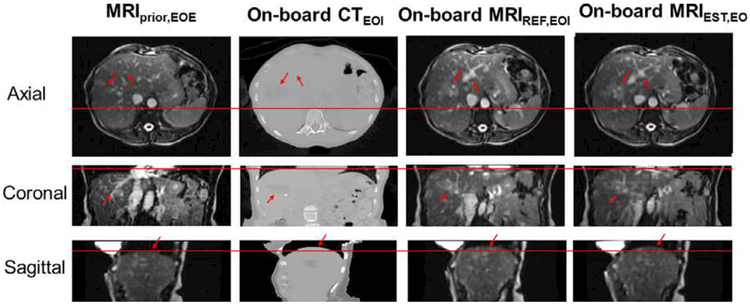
FIG. 4.
The columns from left to right show: Prior MRI (MRIprior) at EOE phase, on-board CT at EOI phase, reference on-board MRI at EOI phase and estimated on-board MRI at EOI phase for the patient study. The rows show the axial, coronal, and sagittal views, respectively. The horizontal line and arrows indicate areas for comparison. [Color figure can be viewed at wileyonlinelibrary.com]

