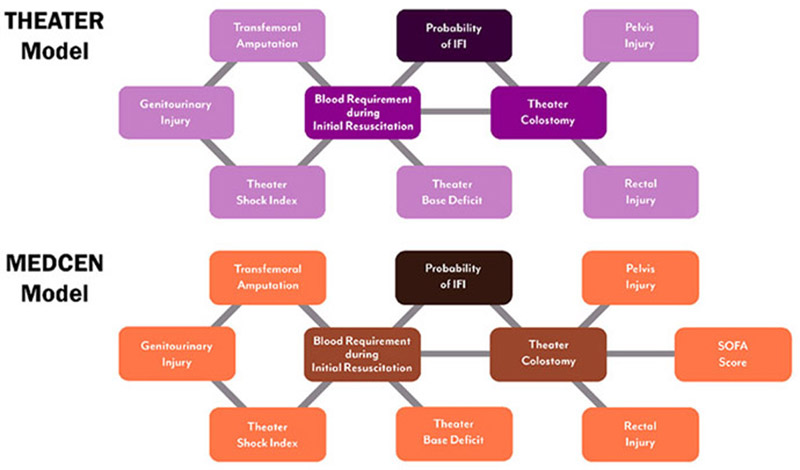
Figure 1.

Graphic representation Bayesian Belief Network models; (A) the THEATER model; (B) the MEDCEN model. Outcomes, first degree associates, and second degree associates are represented by dark, medium, and light shades respectively in both panels.
