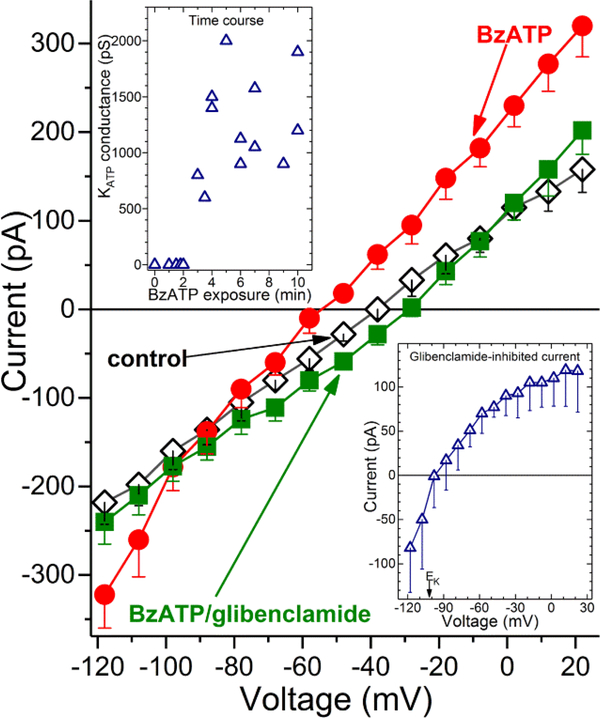
Figure 3.
Detection of a KATP conductance in capillaries during sustained P2X7 activation. Averaged I-V plots (n = 4) obtained in solution A without additives (control), in the presence of 100 μM BzATP and after addition of 0.5 μM glibenclamide. (Lower inset), The I-V relations of the glibenclamide-sensitive current. EK, K+ equilibrium potential. (Upper inset), Time course for the BzATP-induced activation of the glibenclamide-sensitive conductance. The zero-time point represents 12 recordings, while the other data points are from single recordings, which are plotted at their mean sampling times.

