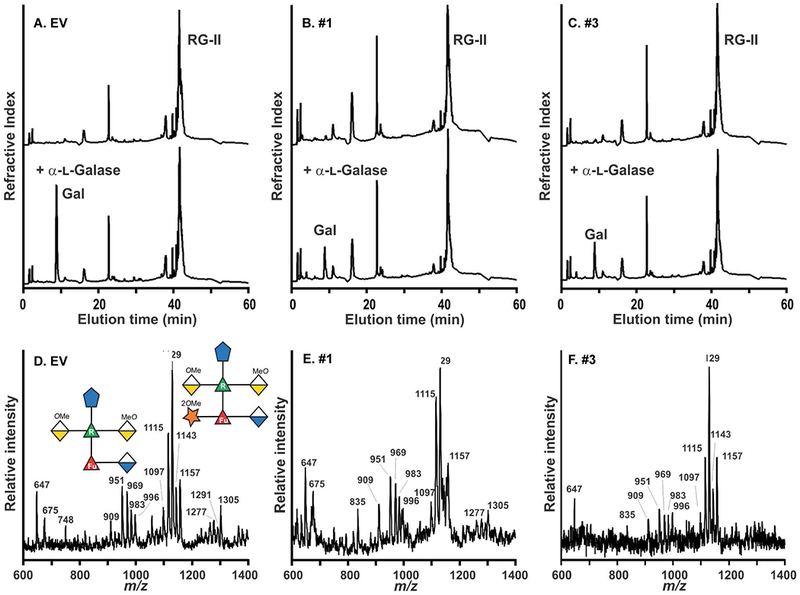
Figure 4: α-l-galactosidase treatment confirms that the RG-II from the hpGGLT1 lines is deficient in α-l-galactose.

(A - C). The HPAEC-PAD profiles of untreated (top) and α-l-galactosidase-treated (bottom) RG-II from the EV control and hpGGLT1 lines. The elution position of galactose, which was the only monosaccharide detected, is shown. (D – F) The negative ion MALDI-TOF mass spectrum of side-chain A generated by selective acid hydrolysis of l-galactosidase-treated RG-II. The predominant oligosaccharide (m/z 1115, 1129, 1143, and 1157) corresponds to side-chain A lacking l-galactose. The differences in mass of 14 Da correspond to differences in the extent of O-methylation of side-chain A. Only low intensity signals (m/z 1277, 1291, and 1305) corresponding to the l-galactose-containing side-chain A were detected. The oligosaccharides structures are represented using a modified SNFG nomenclature. See Figure 1 for details.
