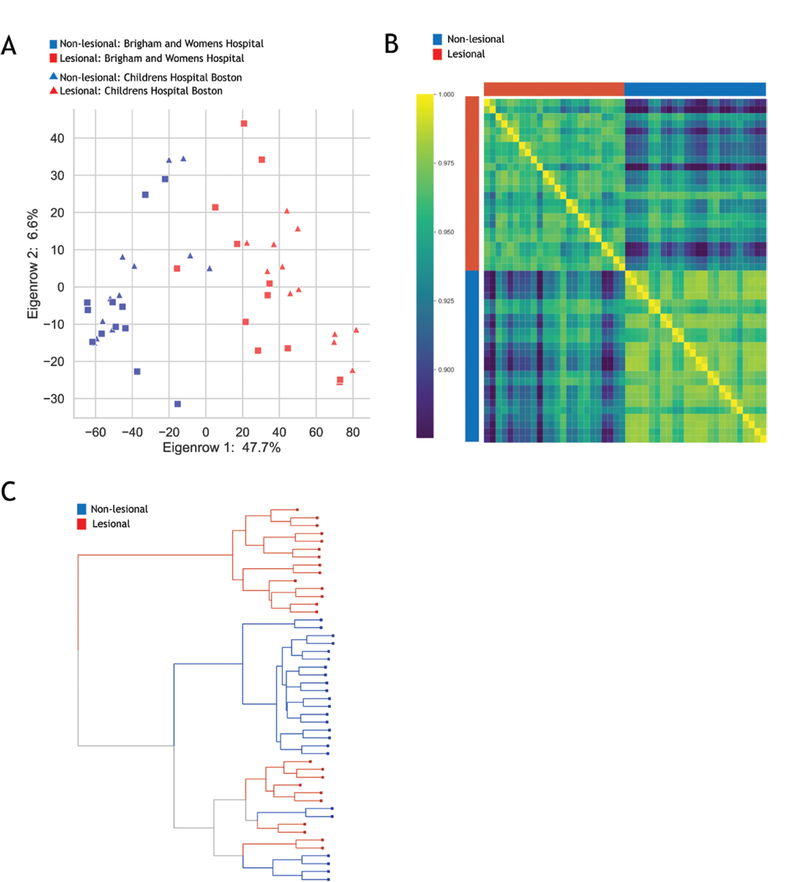
FIGURE 4.

RNAseq of selected biopsies. A, PCA plot of gene expression profiles of comparing areas of macroscopically active inflammation (red) with those collected from macroscopically noninflamed tissue (blue). Samples collected at BWH are in squares, whereas those collected at BCH are depicted as triangles. Note that there is no strong difference between biopsies taken at different centers. B, Heatmap reflecting high correlation among the set of affected biopsies and within the set of unaffected biopsies. C, Hierarchical clustering also illustrating clear distinction between majority of affected and unaffected biopsies.
