
FIGURE 5.
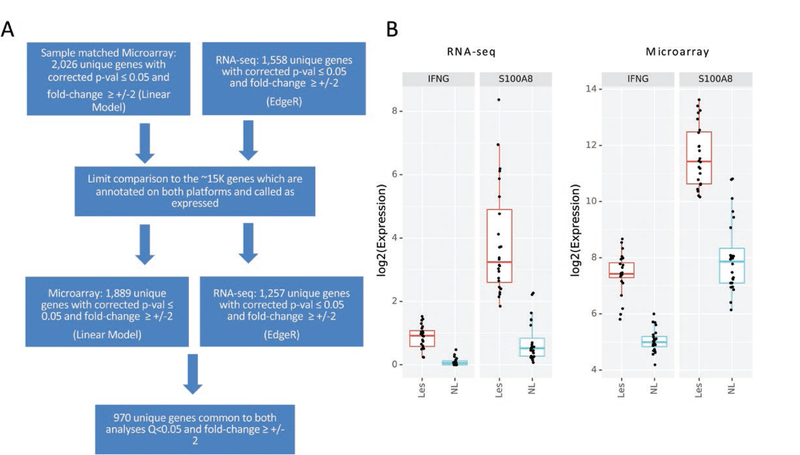
RNAseq compared with matched microarray. A, Flow chart depicting differential analysis for microarray limited to both the matching samples in mRNAseq and matching genes called as expressed, identifying a total of 970 differentially expressed genes in common between the platforms. B, Illustrative example of the differential gene expression of 2 genes, IFNG and S100A8, using RNAseq (left) and microarry (right) among affected (Les) and unaffected (NL) tissue.