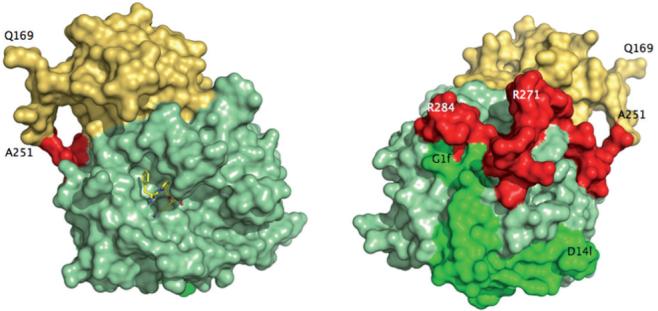
Figure 2.

Crystal structure of meizoIIRRΔF1 at 2.1 Å resolution. Shown is the arrangement of the B chain (light green) relative to the A chain (green) and fragment 2 (gold). The linker region connecting the A chain to the kringle domain of fragment 2 (red) had poor electron density and was modeled in the final refinement assigning zero occupancy to residues 252-286. Also shown (left) is the active site inhibitor PPACK (CPK in yellow). The portion 168-251 of fragment 2 (spanning residues 156-271 of prothrombin in its entirety) folds in the expected kringle configuration (three disulfide bonds connecting 170-248, 219-243, 191-231) docked on exosite II and above the 60-loop (left, see also Fig. 3). The A chain is fully visible in the electron density map only from G1f to D14l (residues 287-318 of prothrombin). The autolysis loop is fully resolved, with the exception of the T149-G149d segment. The orientation at right shows the back of the molecule and corresponds to a 180° rotation along the y-axis relative to the standard orientation at left.
