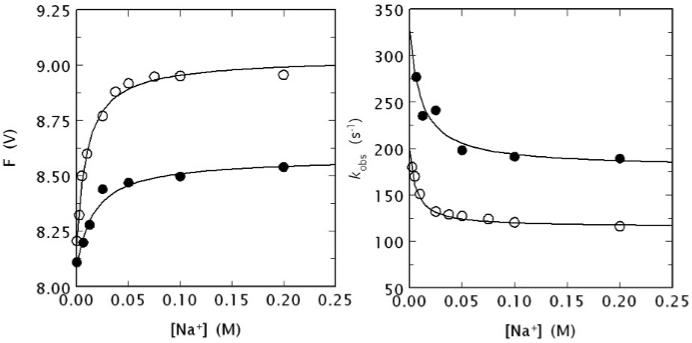
Figure 5.

(Left) Na+ binding curve of human meizoIIRRΔF1 (black circles) obtained from the total change in intrinsic fluorescence determined by stopped flow kinetics (see Fig. 4). Similar results were obtained from direct fluorescence titration (data not shown) performed as reported elsewhere [9, 64]. The binding curve of human thrombin is also shown for comparison (open circles). Experimental conditions are: 50 nM enzyme, 5 mM Tris, 0.1 % PEG, pH 8.0 at 15 °C. The [Na+] was changed by keeping the ionic strength constant at 400 mM with ChCl. Continuous lines were drawn according to the equation F = (Fo + F1 Kapp [Na+])/(1 + Kapp [Na+]), described in detail elsewhere [9], with best-fit parameter values: (meizoIIRRΔF1) F0 = 8.09±0.01 V, F1 = 8.58±0.01 V, Kapp = 59±9 M-1; (thrombin) F0 = 8.19±0.01 V, F1 = 9.03±0.01 V, Kapp = 100±10 M-1 [9]. Note the larger fluorescence change induced by Na+ binding to thrombin compared to meizoIIRRΔF1 and also the slightly higher Na+ affinity measured as an apparent binding constant Kapp. (Right) Values of kobs for the slow phase of fluorescence increase (see Fig. 4) due to Na+ binding to human meizoIIRRΔF1 (black circles) and thrombin (open circles). Experimental conditions are: 50 nM thrombin or meizoIIRRΔF1, 5 mM Tris, 0.1 % PEG, pH 8.0 at 15 °C. Continuous lines were drawn according to eq. 1 in the text, with best-fit parameter values: (meizoIIRRΔF1) k1 = 179±9 s-1, k-1 = 148±8 s-1, KA = 91±9 M-1; (thrombin) k1 = 115±3 s-1, k-1 = 83±6 s-1, KA = 160±20 M-1 [9]. The value of r = k-1/k1 is practically identical for the two enzymes (0.83 vs. 0.72), but the intrinsic Na+ affinity is about two-fold higher for thrombin compared to meizoIIRRΔF1. The value of Kapp (see data at left) can be derived from the equation Kapp = KA/(1 + r) [9] and is in excellent agreement with that determined directly from the titration data shown at left.
