
Figure 1.
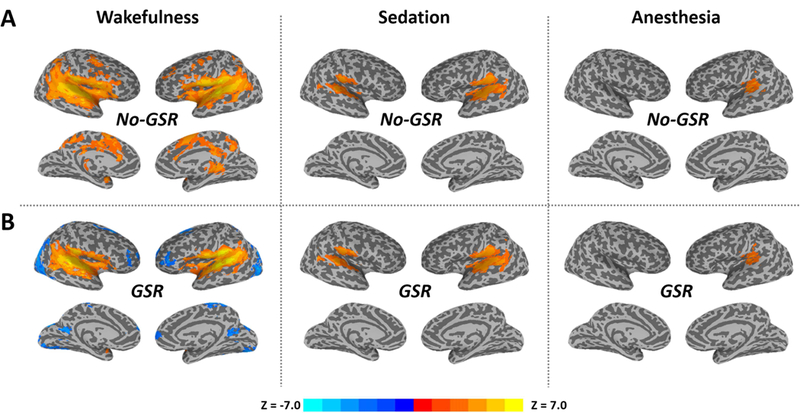
The average of stimulus-induced activity across trials (trial-to-trial mean, TTM) during the peak period (4–5s) in wakefulness, propofol-induced sedation and deep anesthesia. Group-level z-maps (one sample t-tests against zero) were corrected at alpha<0.05 at the cluster level. A. Results without global signal regression (No-GSR). B. Results with GSR.