
Figure 3.
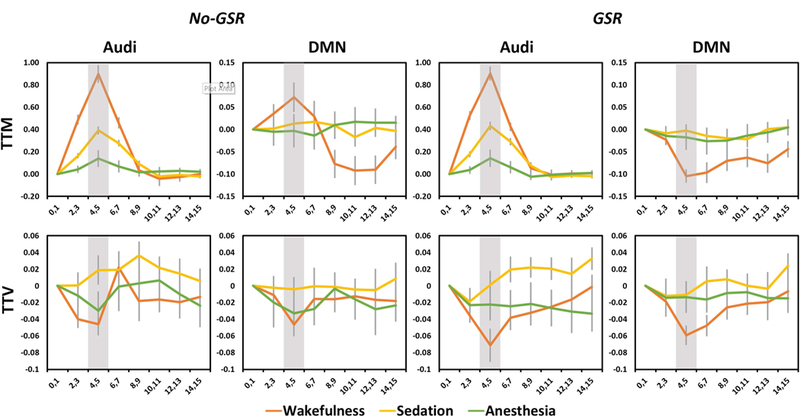
Time courses of average and variability of stimulus-induced activity across trials within the time window after stimulus presentation (0s-15s). The results are shown for the auditory cortex (Audi) and default-mode network (DMN). Shaded areas indicate the peak period (4–5s) of stimulus-induced activity, where trial-to-trial mean (TTM) and trial-to-trial variability (TTV) were calculated. Results without and with global signal regression (No-GSR and GSR) are shown. Error bars indicate ±SEM.