
Figure 5.
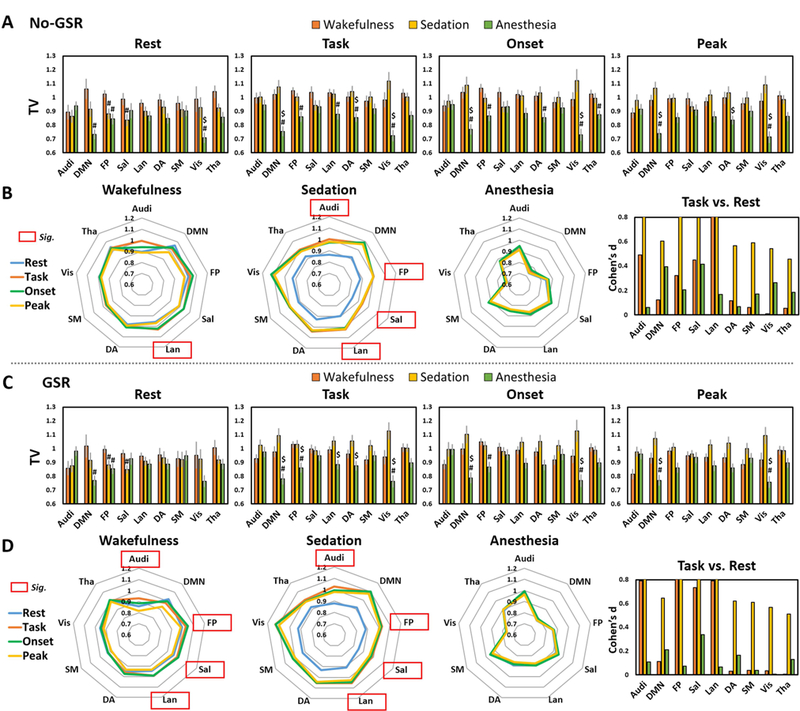
Temporal variability (TV) during resting-state (Rest), task-state (Task), as well as the standard deviations of BOLD signals across trials during stimulus onset (Onset) and peak period (Peak) originally used for TTV calculation. A. TV without global signal regression (No-GSR). #Significant differences against wakefulness by paired sample t-tests (i.e. sedation vs. wakefulness, and anesthesia vs. wakefulness). $Significant differences against sedation by paired sample t-tests (i.e. anesthesia vs. sedation). Error bars indicate ±SEM. B. A visualization of the TV (No-GSR) in a variability “space” across brain networks to highlight the comparisons of Task vs. Rest (task-modulation of TV). Red frames indicate significant task-modulation effects of TV. Results with GSR are shown in C and D. All results were FDR corrected. The right panels in B and D show the effect size (Cohen’s d) for task vs. rest, where d=0.2 is considered a ‘small’ effect size, 0.5 represents a ‘medium’ effect size and 0.8 a ‘large’ effect size. The range limit of y-axis is from 0–0.8 for illustrative purpose. Overall, all reported significant results are close to or above d=0.8.