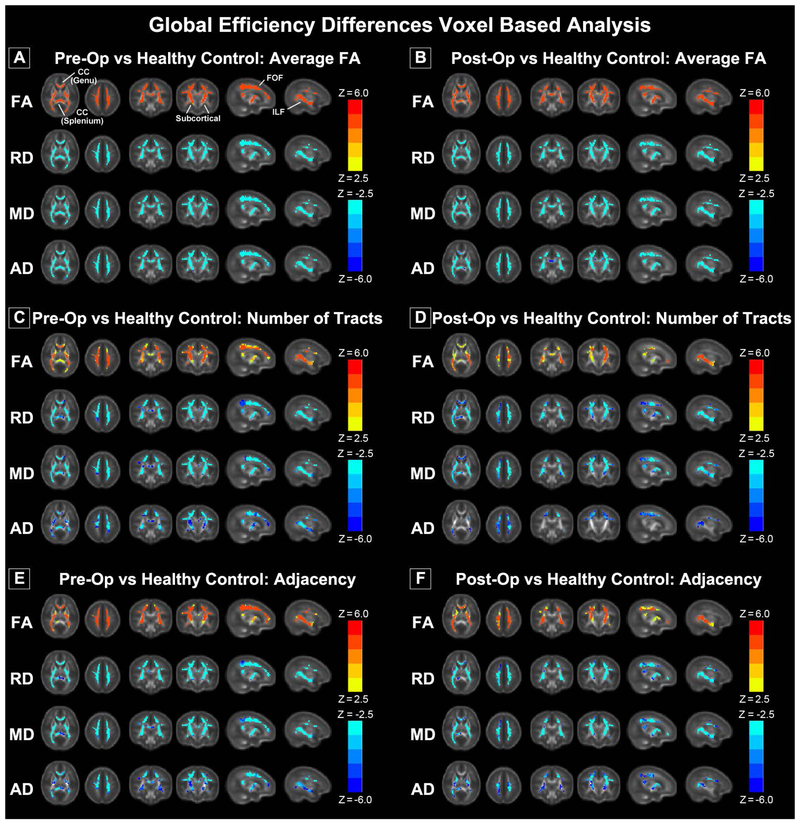
Figure 6.
Correlation of DTI metrics (FA, RD, MD, AD) with global efficiency for pre-operative CHD (A, C, E) and post-operative CHD (B, D, F) for average FA connectome (A, B), # of tracts connectome (C, D) and adjacency connectome (E, F). (Hot colors = positive correlation, cold colors = negative correlation, all regions significant at FWE-corrected p < 0.05).

