
Figure 3.
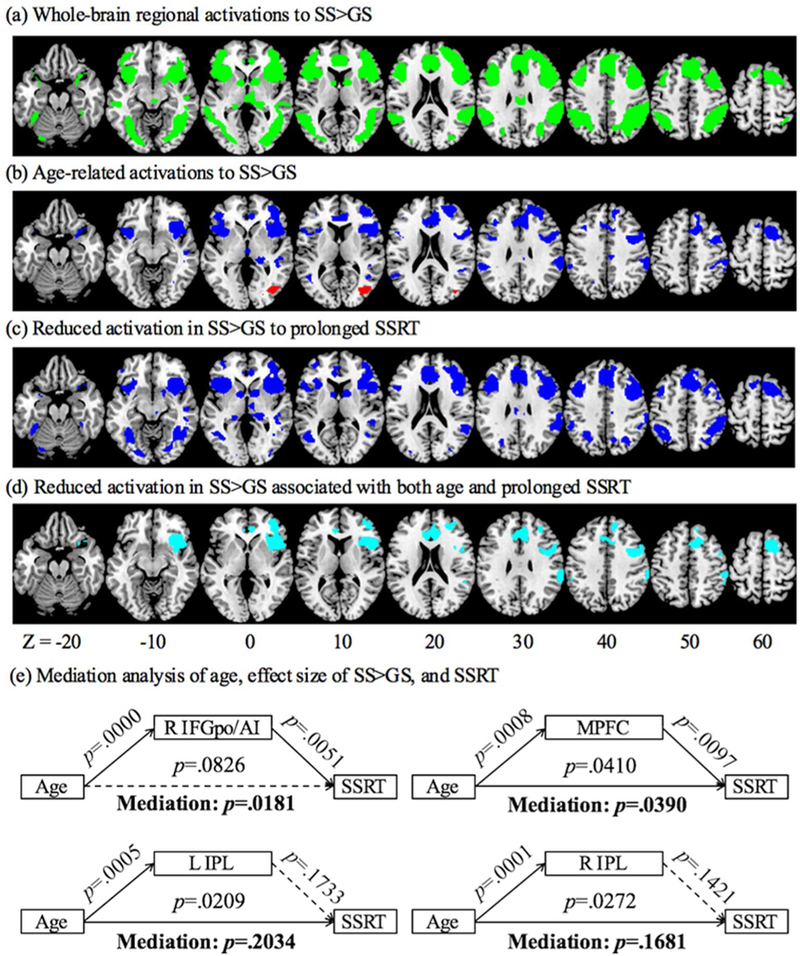
(a) Whole-brain activations of SS>GS (green); (b) Clusters showing altered activation with age in linear regression (red/blue: positive/negative correlation); (c) Clusters showing decreased activation with prolonged SSRT in linear regression (blue); (d) Clusters showing decreased activation both with age and prolonged SSRT (cyan); and (e) Mediation analysis of age, effect size of SS>GS, and SSRT. BOLD activations of the right IFGpo/AI and MPFC each completely and partially mediates the correlation between age and SSRT.